Trading
Why 6R can be a worse trade than 2R
A reward-to-risk ratio of 6 ratio 1 sounds better than 2 ratio 1. This video takes one entry, one target and two different stop distances, and the 6 ratio 1 version is the one that loses - because R is defined by the stop, so moving the stop does not improve the trade, it changes the unit you are measuring it in.

This video explains how traders measure a result and where that measurement breaks. It is educational material, not financial advice, and nothing in it is a recommendation to trade. I am not a licensed financial adviser.
Two people take the same trade, on the same instrument, on the same day. One of them reports a four thousand two hundred dollar profit. The other reports two R.
Only one of those two numbers can be checked by the person reading it.
Only one of those numbers can be checked. And it is not the one with the currency symbol in front of it, which is the number this entire genre is built on posting.
Why it matters
Before any of the arithmetic, the number that belongs at the top of every video like this one.
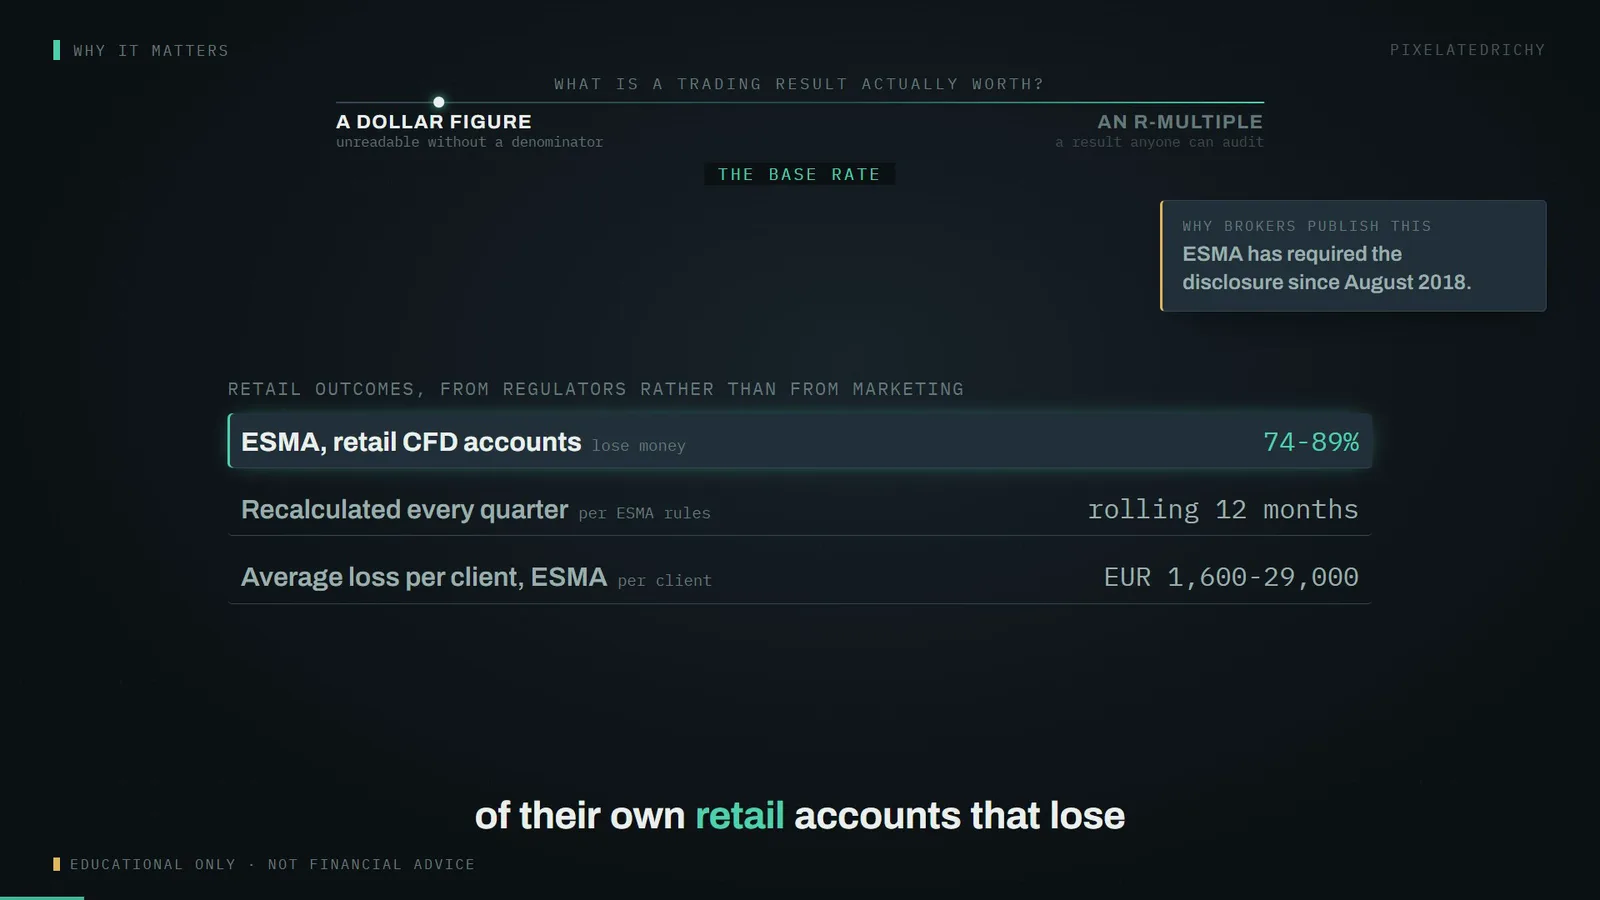
ESMA has required the disclosure since August 2018.
European regulators require brokers to publish the share of their own retail accounts that lose money. The figures sit between seventy four and eighty nine percent. Those are the brokers' own numbers about their own customers. That is the denominator every screenshot you have ever been shown has to be read against.
This is a video about a unit of measurement.
So this is not a strategy video and there is no setup in it. It is a video about how a result is measured, which sounds like the boring part and is the part that decides whether anything else you learn can be evaluated at all.
Compute R on paper. Size a position from it. Read a reward:risk ratio sceptically.
By the end you will be able to compute R for any trade on paper, size a position from it, and say precisely why a six to one reward-to-risk ratio can be a worse trade than a two to one.
The mental model
R is the distance from your entry to your stop.
Here is the definition, and it is short enough to hold in your head.
R is the amount you lose if you are wrong. In price terms it is the distance from where you got in to where you have decided to get out. Van Tharp, who put the term into common use, defines it as "the initial risk taken in a given position, as defined by one's initial stop loss."
Van Tharp Institute, A Short Lesson on R and R-Multiples.
An R-multiple is then just a result divided by that distance. Lose exactly what you planned to lose and you are at minus one R. Make twice it and you are at plus two.
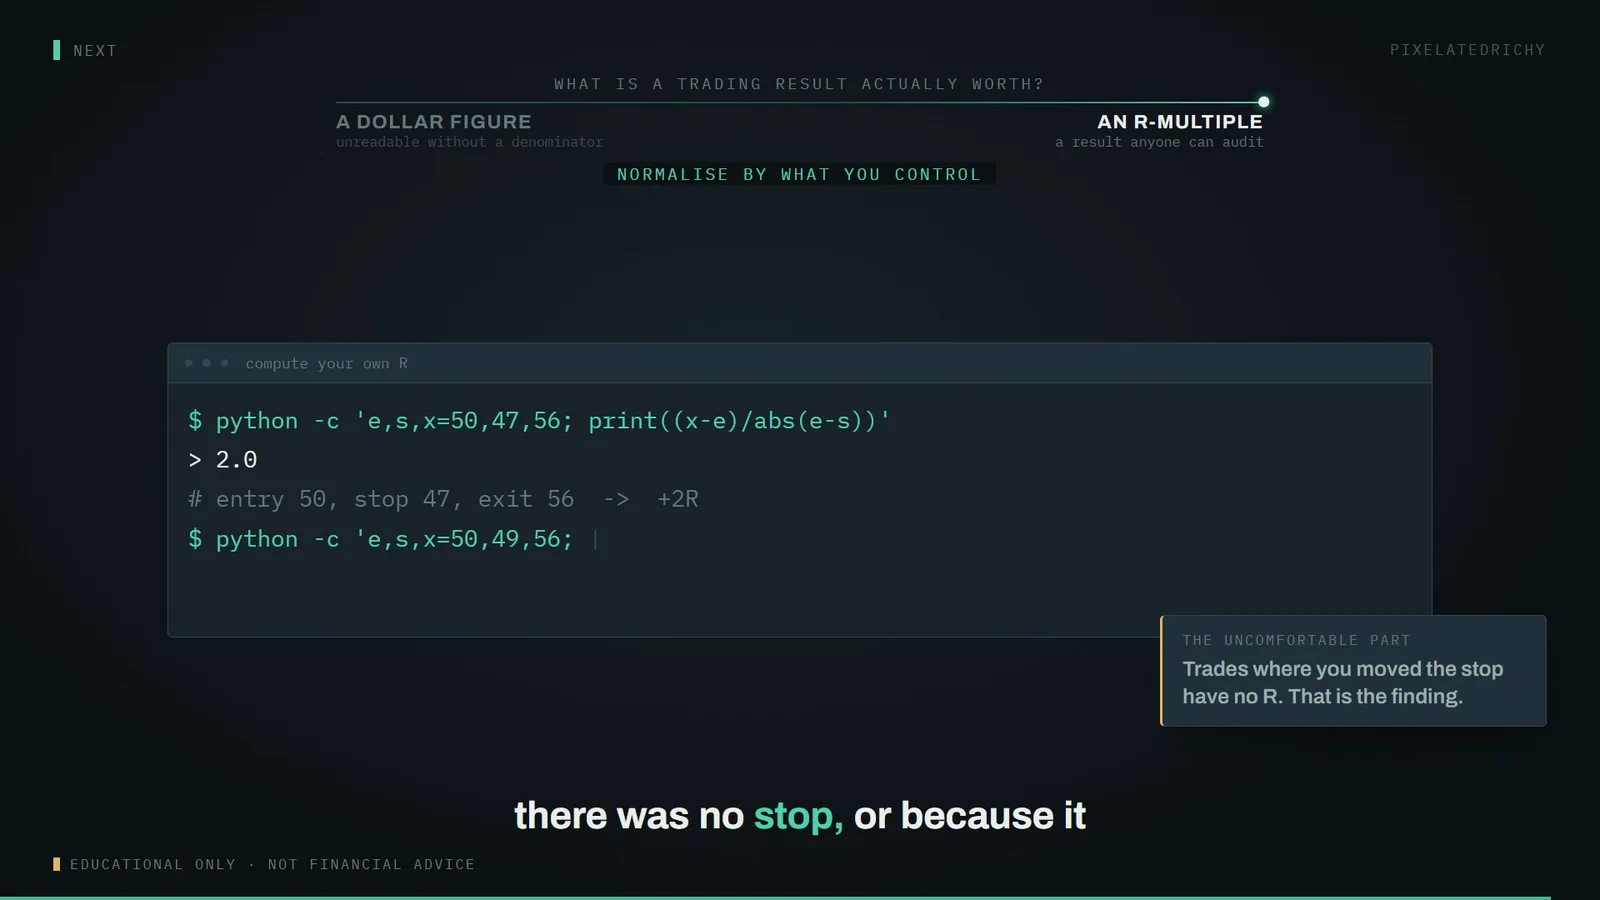
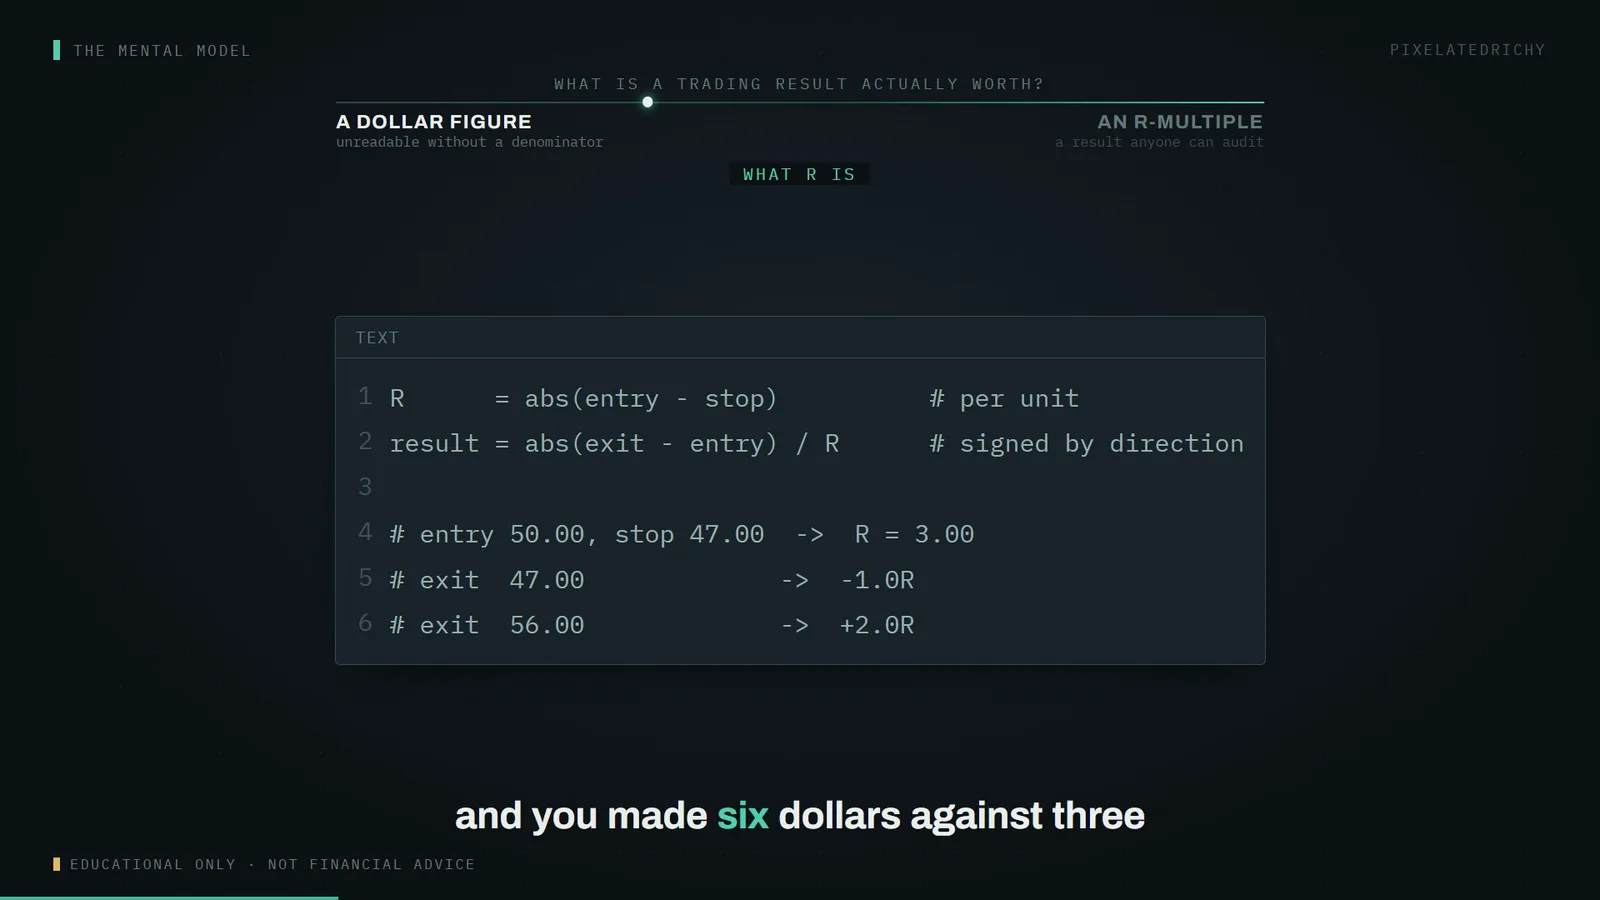
Tharp's own worked example. Buy at fifty, plan to get out at forty seven, and your R is three dollars a share. Exit at forty seven and you lost what you risked: minus one R. Exit at fifty six and you made six dollars against three at risk, so plus two R.
R is dimensionless. It carries no currency, no instrument and no account size.
Notice what has been removed. The currency is gone, the account size is gone, the instrument is gone. What is left is a number that means the same thing whether the account holds two hundred dollars or two million.
And this is where R stops being terminology and starts doing work, because the same distance decides how large the position is.
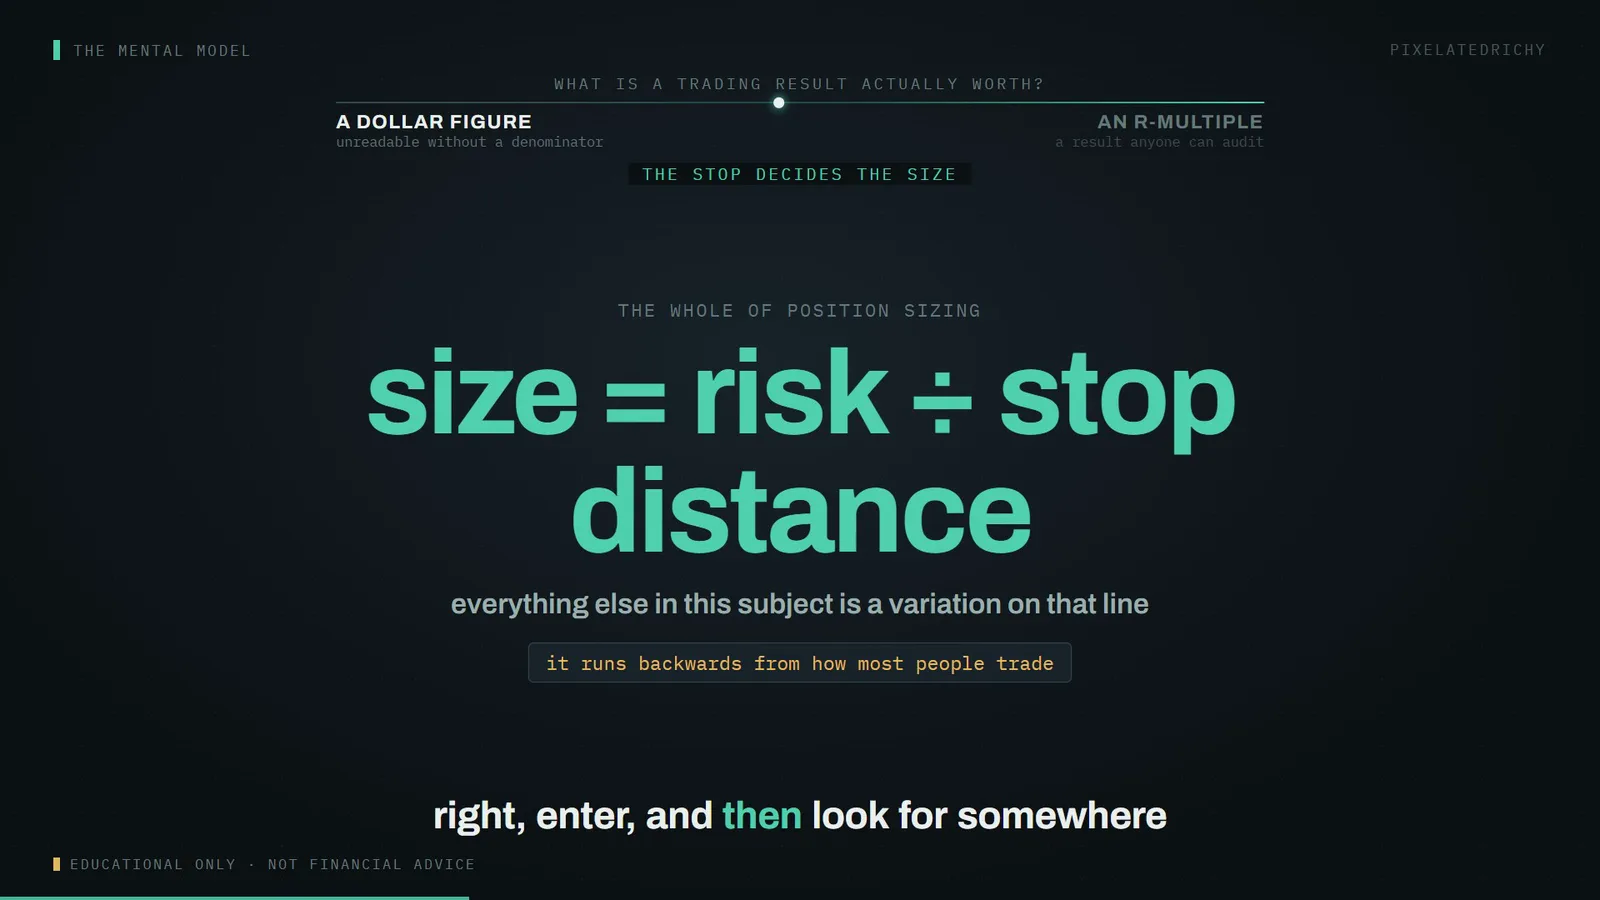
You choose what one R is worth to you in currency first. Then the stop distance tells you the risk per unit. Divide one into the other and you have the position size. The stop comes first and the size falls out of it.
A different R on every trade means the trades cannot be added up.
Most people do this in the opposite order. They pick a size that feels right, enter, and then look for somewhere to put a stop that does not hurt too much. That produces a different R on every trade, which means the results cannot be added up into anything.
The mechanism
So let us take one, with every number fixed before the outcome is known.
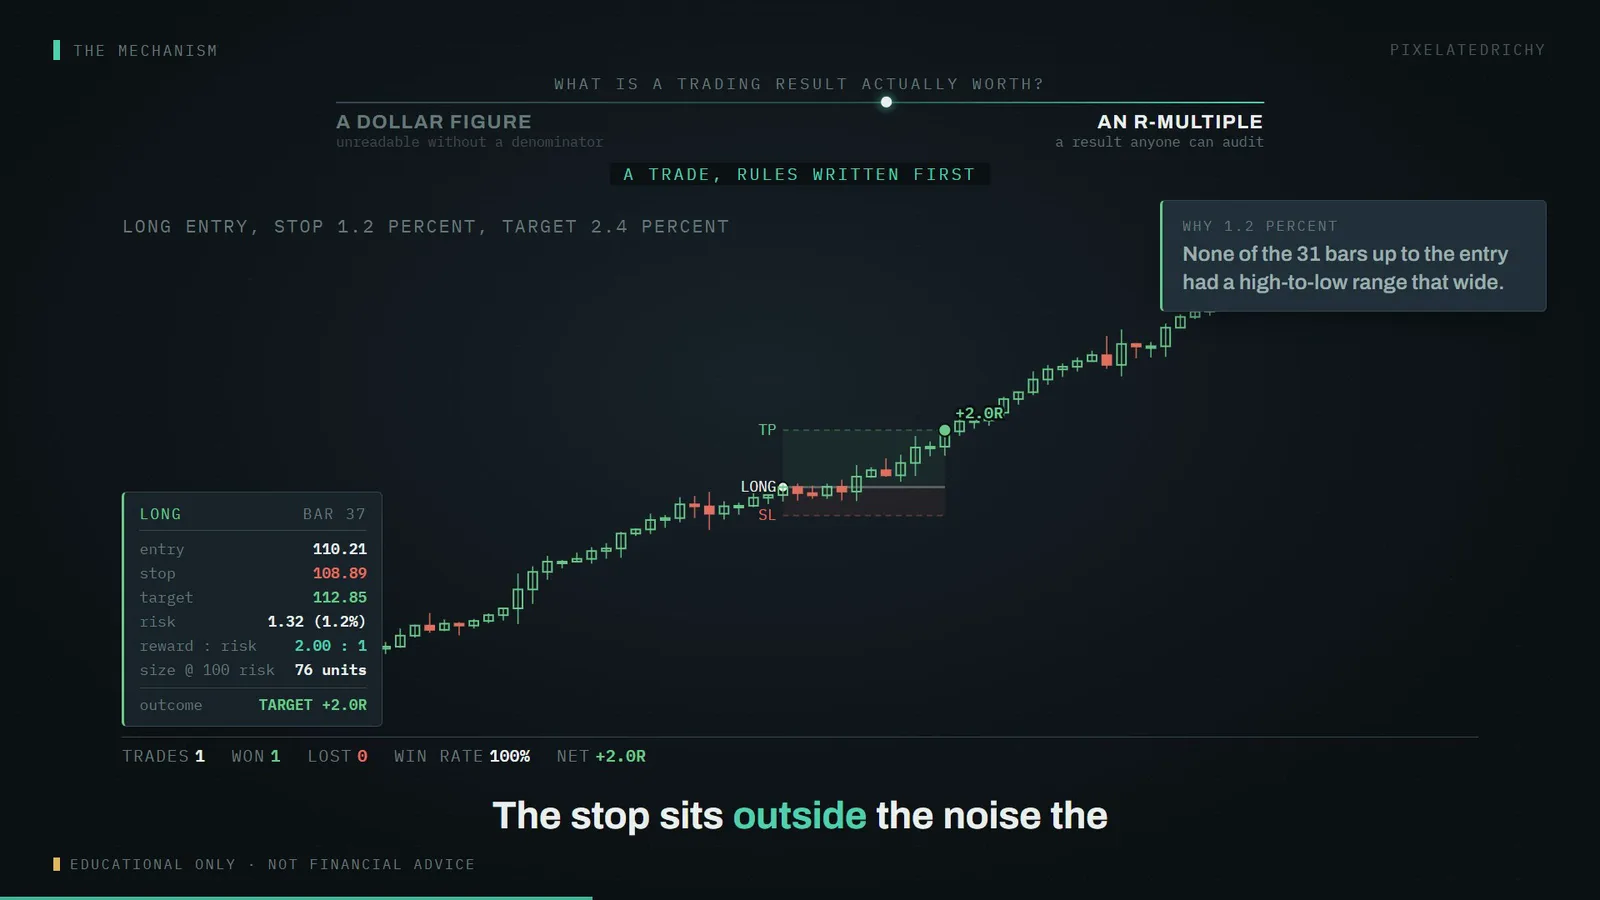
Long at the close of bar thirty seven. Stop one point two percent below. Target two point four percent above, which is two times the risk. The panel reads two to one, and at a hundred dollars of risk the position is about seventy six units.
None of the 31 bars up to the entry had a high-to-low range that wide.
The stop distance was not chosen to look good. Across the thirty one bars up to and including this entry, all but three had a high to low range narrower than one point two percent. The stop sits outside the noise the series was actually producing.
Target reached ten bars later. Plus two R.
Price runs and the target is reached eleven bars later. Plus two R.
Now the version that gets posted.
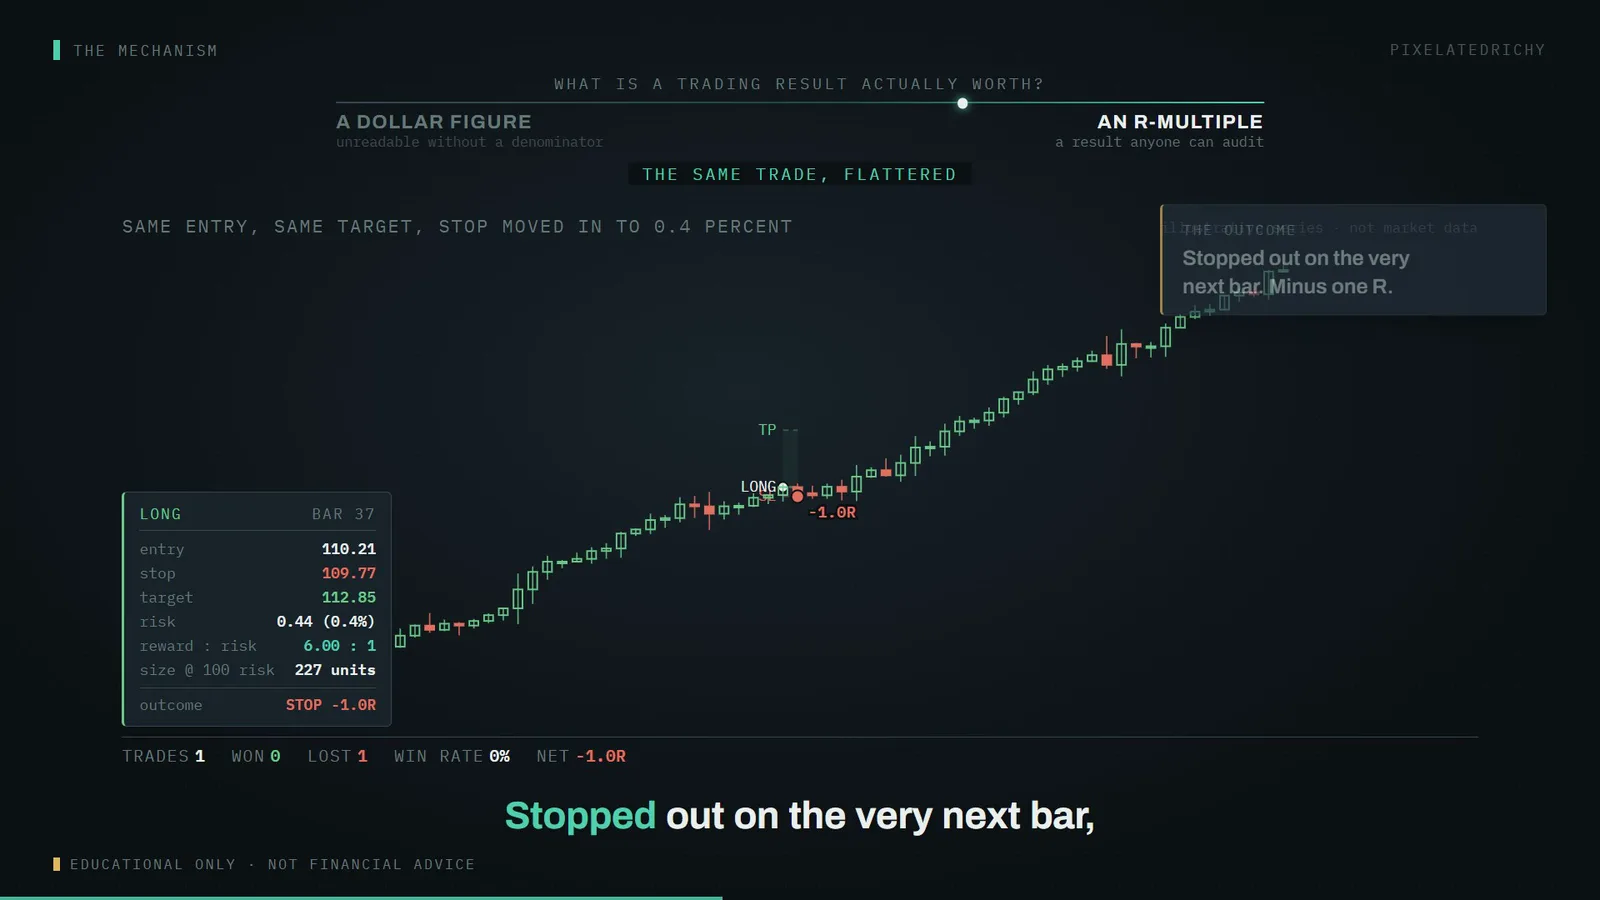
Same entry bar. Same target. The only change is the stop, moved in to four tenths of a percent. Read the panel: the reward to risk ratio is now six to one, and the position size has tripled to about two hundred and twenty seven units for the same hundred dollars of risk.
24 of those same 31 bars had a range wider than this stop.
Six to one is the number you would put in a screenshot. Here is the number you would not. Of those same thirty one bars, twenty four had a high to low range wider than the stop that was just set. It was not protecting the idea from anything. It was sitting inside the ordinary movement of the series.
Stopped out on the very next bar. Minus one R.
Stopped out on the very next bar, minus one R, on the way to a target that the wide-stop version of the identical trade went on to reach.
So hold the two side by side, because the lesson is not that tight stops are bad.
Tight stops are not bad. The same seven entries with the 0.4% stop return +35R on this series.
The entry did not change. The target did not change. The market did not change. The only thing that moved was the denominator, and moving the denominator improved the ratio while making the trade worse. A reward to risk ratio is a claim about a distance you chose, and you can make it say almost anything.
You cannot improve a trade by moving the stop. You can only change the unit it is measured in.
An R measured against a risk you were not taking is not comparable to anything.
That is the sentence the episode exists for. The stop is not a dial for tuning your statistics. It is the definition of your unit, and if you move it for the look of the number, every R you report afterwards is measured against a risk you were not really taking.
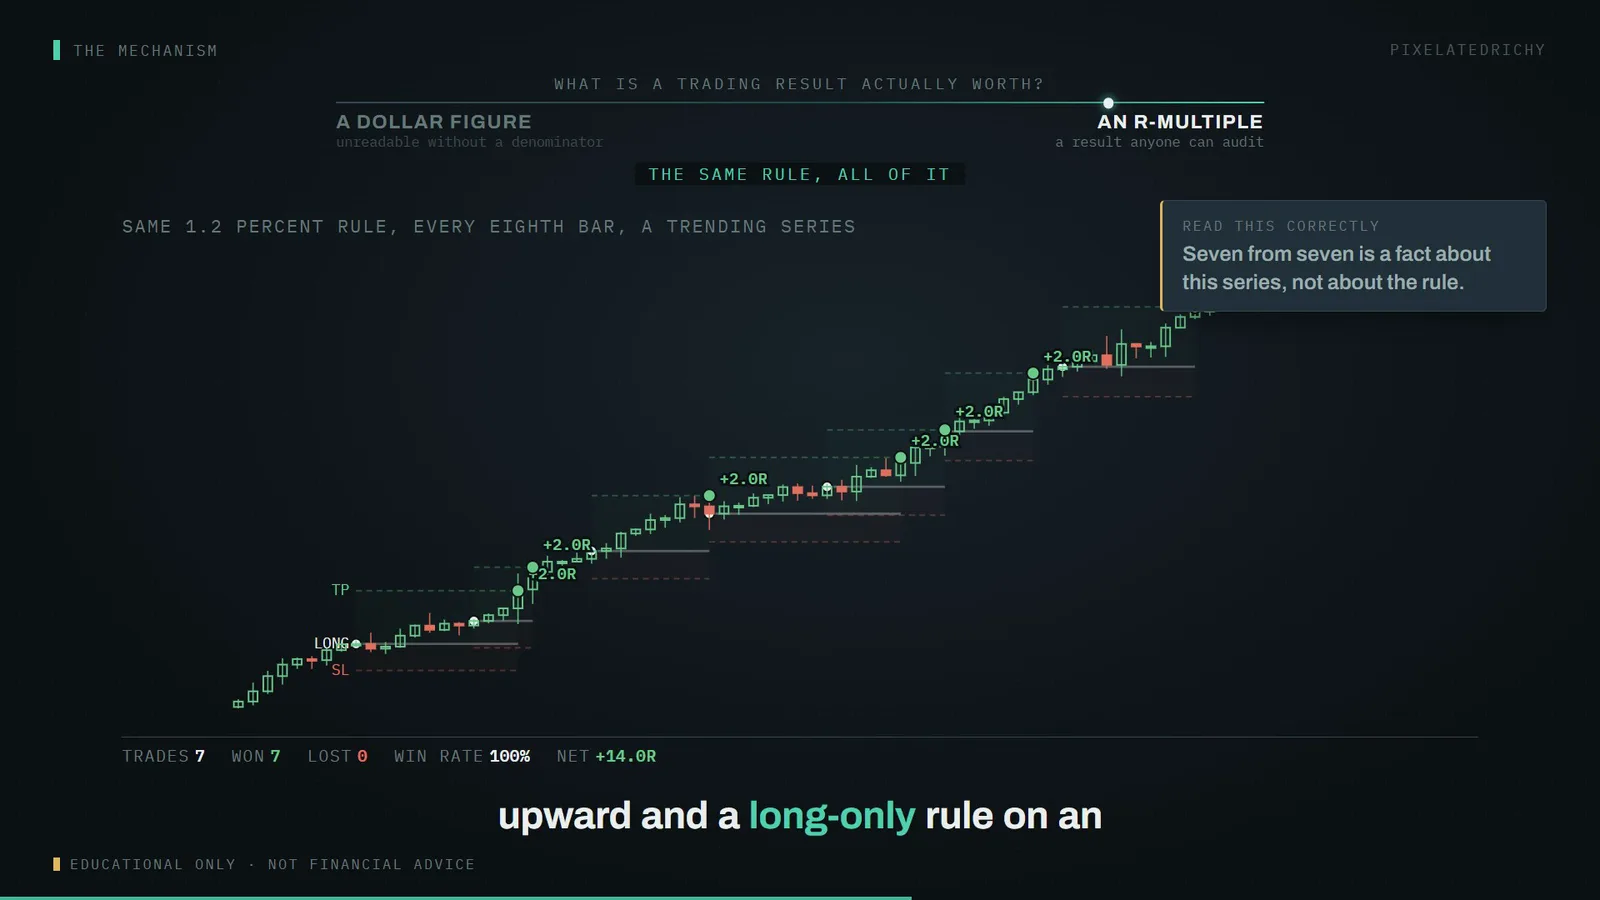
One worked trade proves nothing, so take the same rule at a fixed cadence and let the series choose the entries instead of me. Every eighth bar, same stop, same target.
Seven from seven is a fact about this series, not about the rule.
Seven trades, seven winners, plus fourteen R. And that is not evidence of anything, because this series trends upward and a long-only rule on an upward series wins. The tally is describing the data, not the method.
Same rule. Same stop, same target, same cadence, same code. A series that goes nowhere.
Seven from seven, then zero from seven. Same rule. Different series.
Zero winners, seven losers, minus seven R. And that is a fact about this series too. Every one of those seven was taken correctly by the rule's own definition, and every one of them lost. A trade being correct and a trade making money are different properties, and if you only ever see the winners you will never learn to separate them.
A good trade can lose. It is still a good trade.
A reckless trade that wins is still a reckless trade.
That is worth saying plainly, because it is the hardest idea in this subject. A trade taken by a rule you wrote down in advance, sized properly, stopped where the idea is wrong, can lose. It was still the right trade. Judging a decision by its outcome is how people abandon a working process after four bad days.
And here is what the unit buys you once you have it.
Two strategies. One wins sixty percent of the time and makes one R when it wins. The other wins forty percent of the time and makes two R. In dollars, on two different accounts, those are not comparable at all. In R they are directly comparable, and the arithmetic says they have the same edge: a fifth of an R per trade.
The line is what the arithmetic promises. Neither drawn path reached it.
The straight line is what that edge promises over forty trades: plus eight R. Neither path got there. On this draw the sixty percent version finished up six R and the forty percent version up two, from identical expectancy. Same edge, same number of trades, and one of them three times the other - after a drawdown half again as deep.
One more thing, and it is the part the genre leaves out.
Minus one R is not the worst case. It is the best case of a loss. Tharp says this directly: losses can be bigger than minus one R when the market gaps through your exit price, and bigger again when you fail to get out where you said you would.
The generator has no gaps - each bar opens at the previous close.
That applies to everything you have just watched. The series in this video are synthetic, and the generator opens every bar at the previous bar's close, so it contains no gaps at all. It is a kinder market than the real one, and the stops in it are more reliable than yours will be.
Back to the anomaly
So go back to the two people who took the same trade.
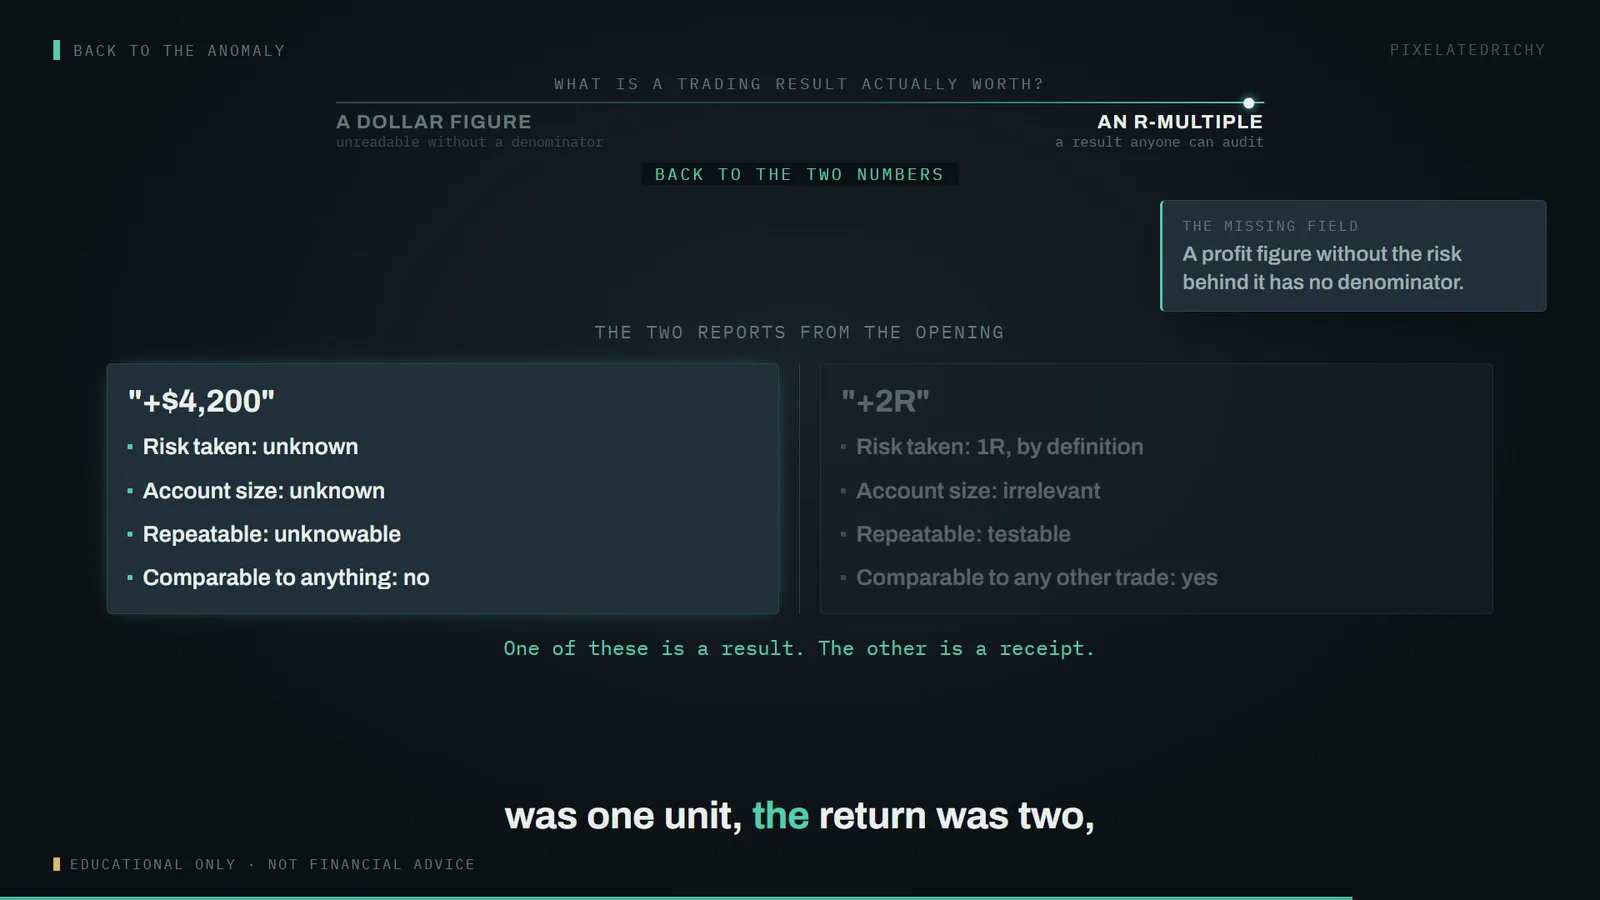
A profit figure without the risk behind it has no denominator.
The four thousand two hundred dollars tells you nothing. It could be a twenty R triumph on a small account or a quarter of an R on a large one, and it is compatible with a stop that was never set. The two R tells you the risk was one unit, the return was two, and it can be placed next to any other trade on any other instrument in any other year.
The dollar figure is the one that gets posted.
Which is, of course, exactly why the dollar figure is the one that gets posted. It is the larger-looking number and it is unfalsifiable, and those two properties travel together more often than is comfortable.
What to look at next
So the thing worth doing is not finding a better entry. It is going back through your last twenty trades and re-expressing every one of them in R, using the stop you actually had at the moment you entered.
Trades where you moved the stop have no R. That is the finding.
Some of them will not convert, because there was no stop, or because it moved. Those trades have no R and cannot be added to anything. That is not a gap in the record. That is the record.
Next: why a strategy that wins forty percent of the time can beat one that wins sixty, and the single line of arithmetic that decides it.