Trading
Every trading indicator is the same three lines of maths
MACD, EMA, SMA and the opening range break get sold as four different ideas. Three of them are the same operation with a different weighting, and the fourth is not an indicator at all - it is a conditional on the clock.
This video explains what these indicators compute and where they fail. It is educational material, not financial advice, and nothing in it is a recommendation to trade. I am not a licensed financial adviser.
MACD, EMA, SMA and the opening range break are sold as four different ideas. Three of them are one operation with a different weighting, and the fourth is not an indicator at all — it is a conditional on the clock. Once you see the operation, the thing you were hoping to tune turns out to be the one thing you cannot tune.
Why it matters
Every claim in this genre has a denominator, and the people who publish it are the brokers themselves.
Since 2018, ESMA has required every CFD provider selling to EU retail clients to display the percentage of its own retail accounts that lost money, recalculated quarterly over the preceding twelve months.1 Across EU national regulators' analyses, that figure sits between 74% and 89%, with average losses per client ranging from €1,600 to €29,000.2
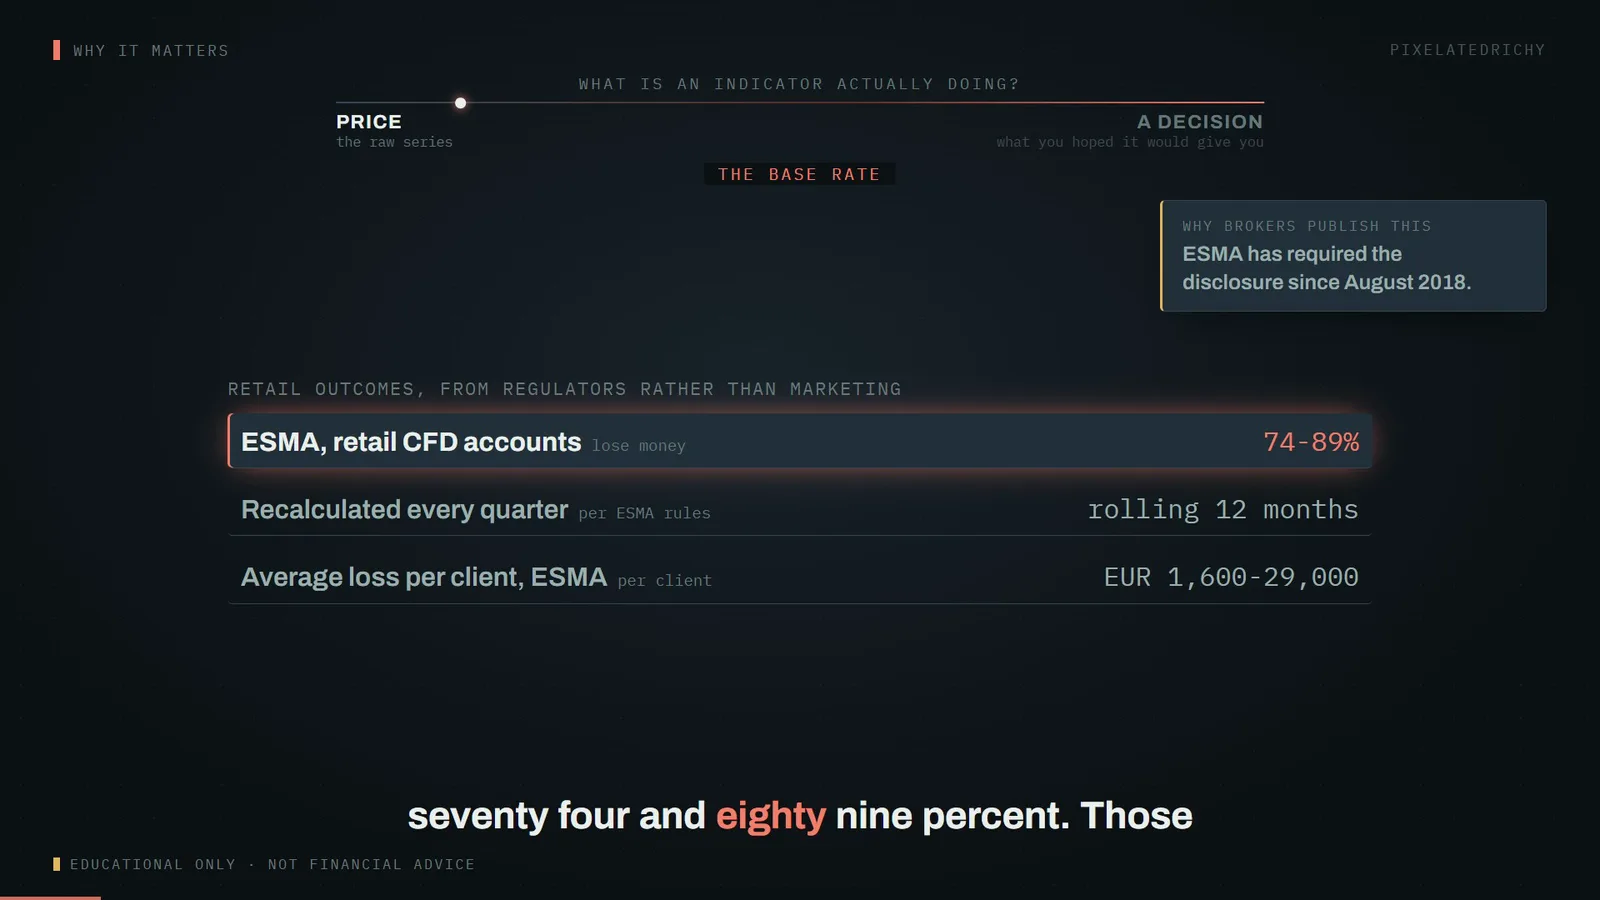
That is not a statistic about people who picked the wrong indicator. It is the base rate for the activity, published under compulsion by the firms with the strongest possible incentive to publish something flattering. Read every "this strategy works" claim against it.
The mental model
A price series is a signal. It has fast components — the ones you call noise — and slow components, the ones you call trend. A moving average is a low-pass filter: it attenuates the fast components and passes the slow ones. That is the entire mechanism, and it is the same mechanism as in an audio equaliser or a thermostat.
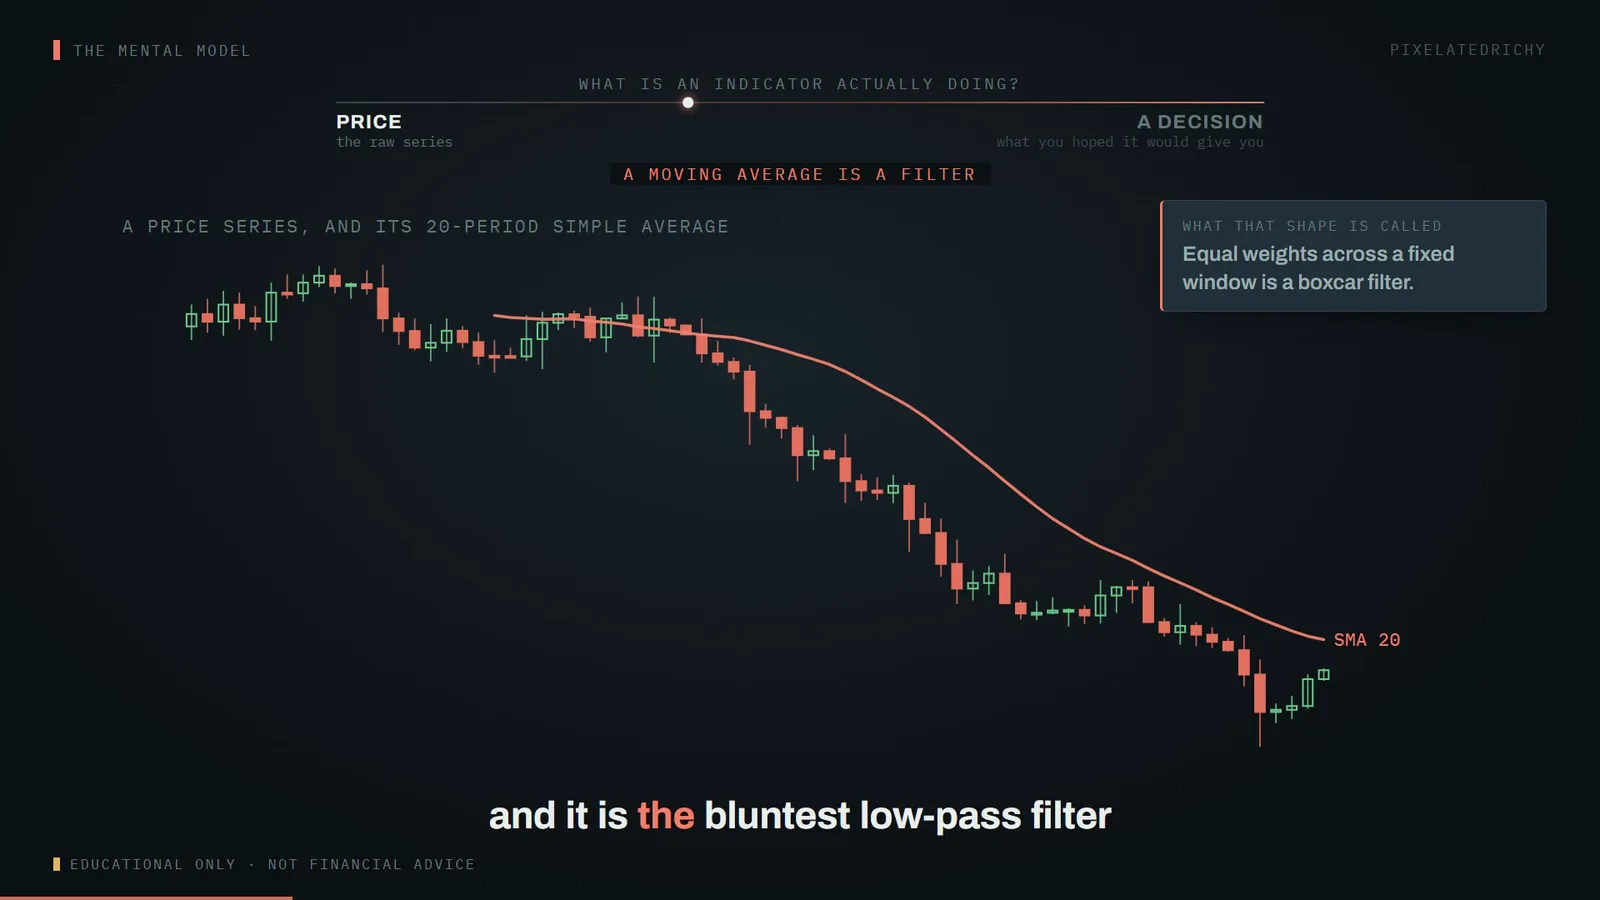
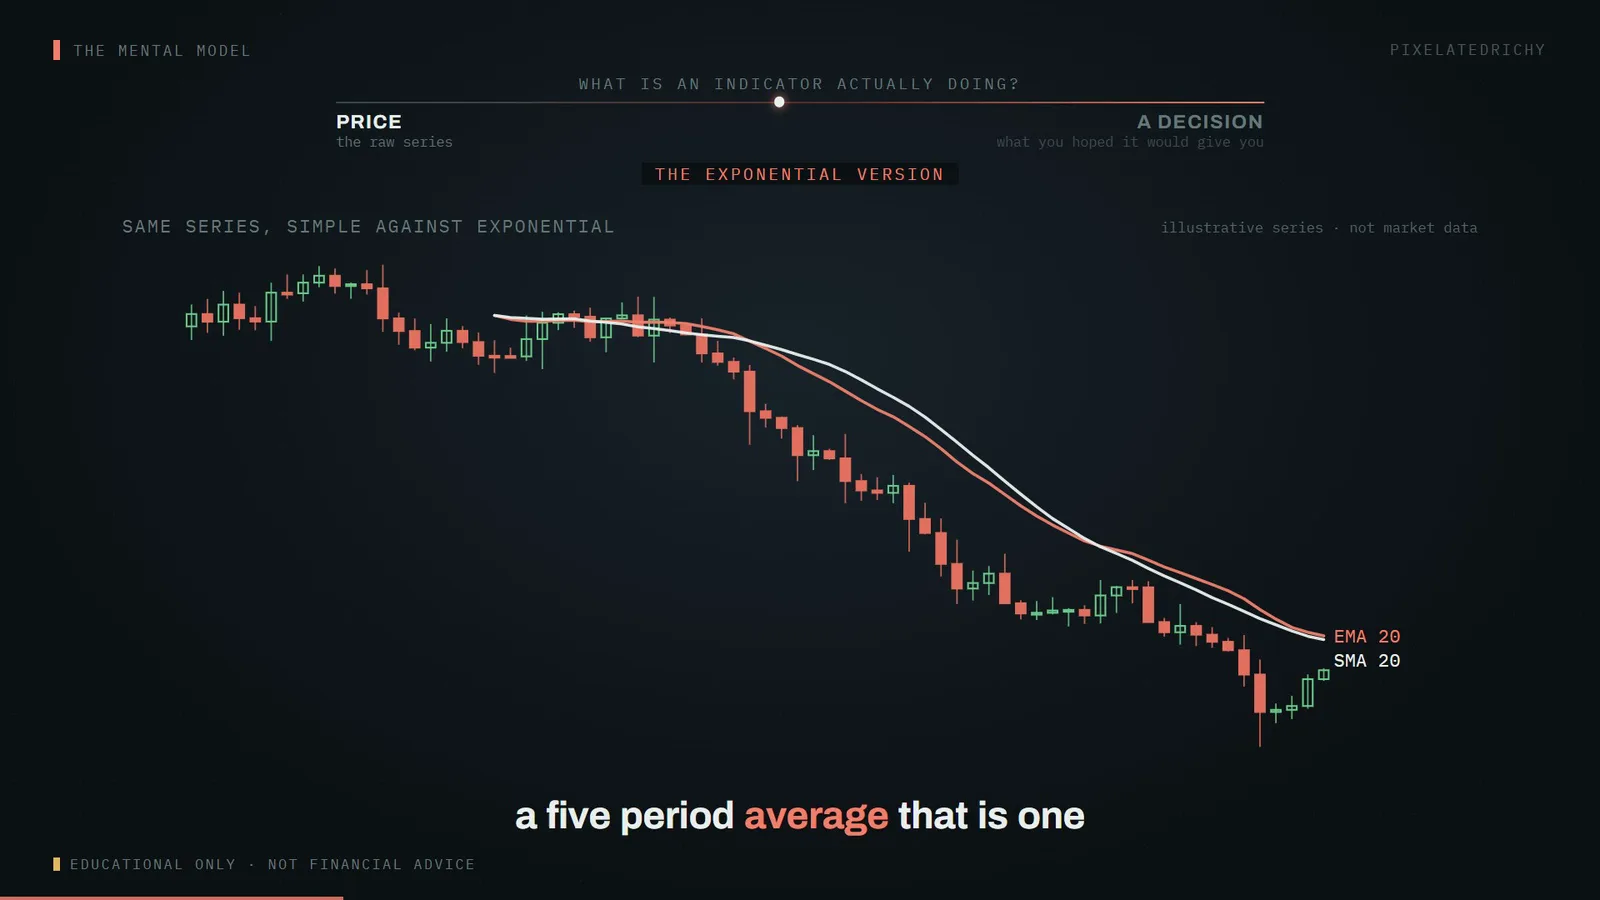
The simple moving average is the plainest version: take the last n closes, add them, divide by n. Every one of those n prices carries exactly the same weight, and the price from n+1 periods ago carries none at all. The exponential version keeps all history, weighted geometrically, which is why it turns sooner.
multiplier = 2 / (n + 1)

EMA = (Close - EMA_prev) * multiplier + EMA_prev

// n = 5  ->  multiplier = 0.333
// n = 26 ->  multiplier = 0.074
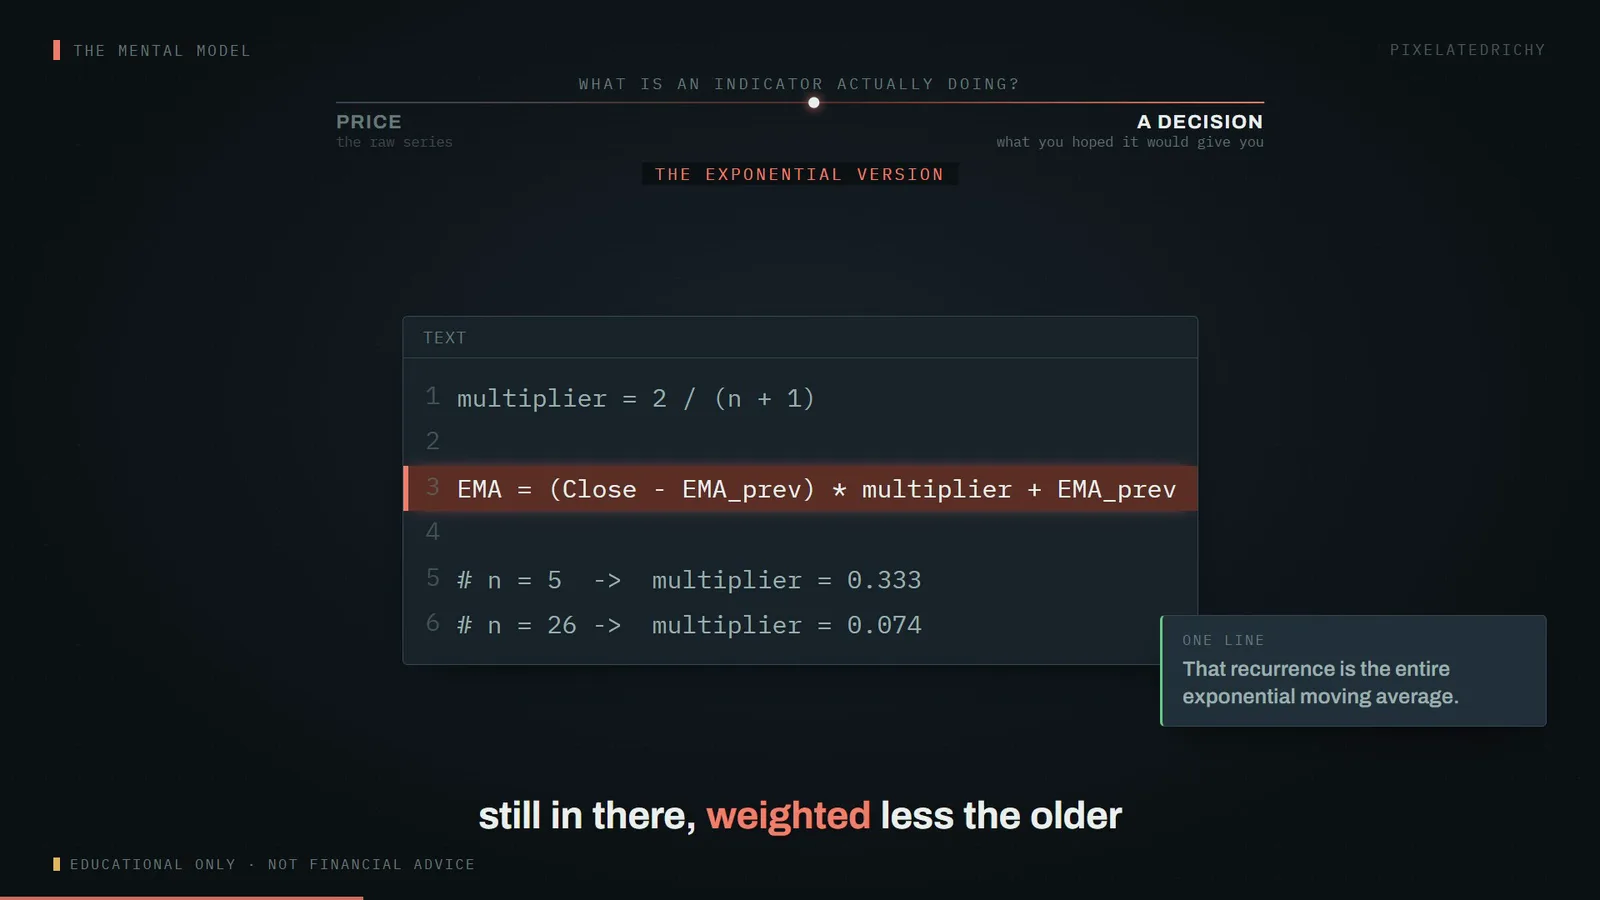
That recurrence is the whole exponential moving average. By convention the series is seeded with a simple average of the first n periods, which is what the chart engine used here does.3
| Name | What it computes | Weighting |
|---|---|---|
| SMA | average of the last n closes | equal, then zero |
| EMA | recursive average over all history | geometric, 2/(n+1) |
| MACD | fast EMA minus slow EMA | band-pass, from two low-passes |
| ORB | high and low of the first k bars | not a filter — a conditional on the clock |
MACD earns its own row for the opposite of the usual reason. Subtracting one low-pass filter from another removes both the very slow components and the very fast ones, leaving a band in the middle. Signal processing has a name for that object: a band-pass filter. It is not a third kind of thing.
The mechanism
Here is the part that is not a matter of opinion.
The average of the last n closes sits, on average, at the centre of that window — not at its leading edge. So a simple moving average lags price by roughly (n−1)/2 periods. You cannot tune that away, because it is not a setting. It is what taking an average means.
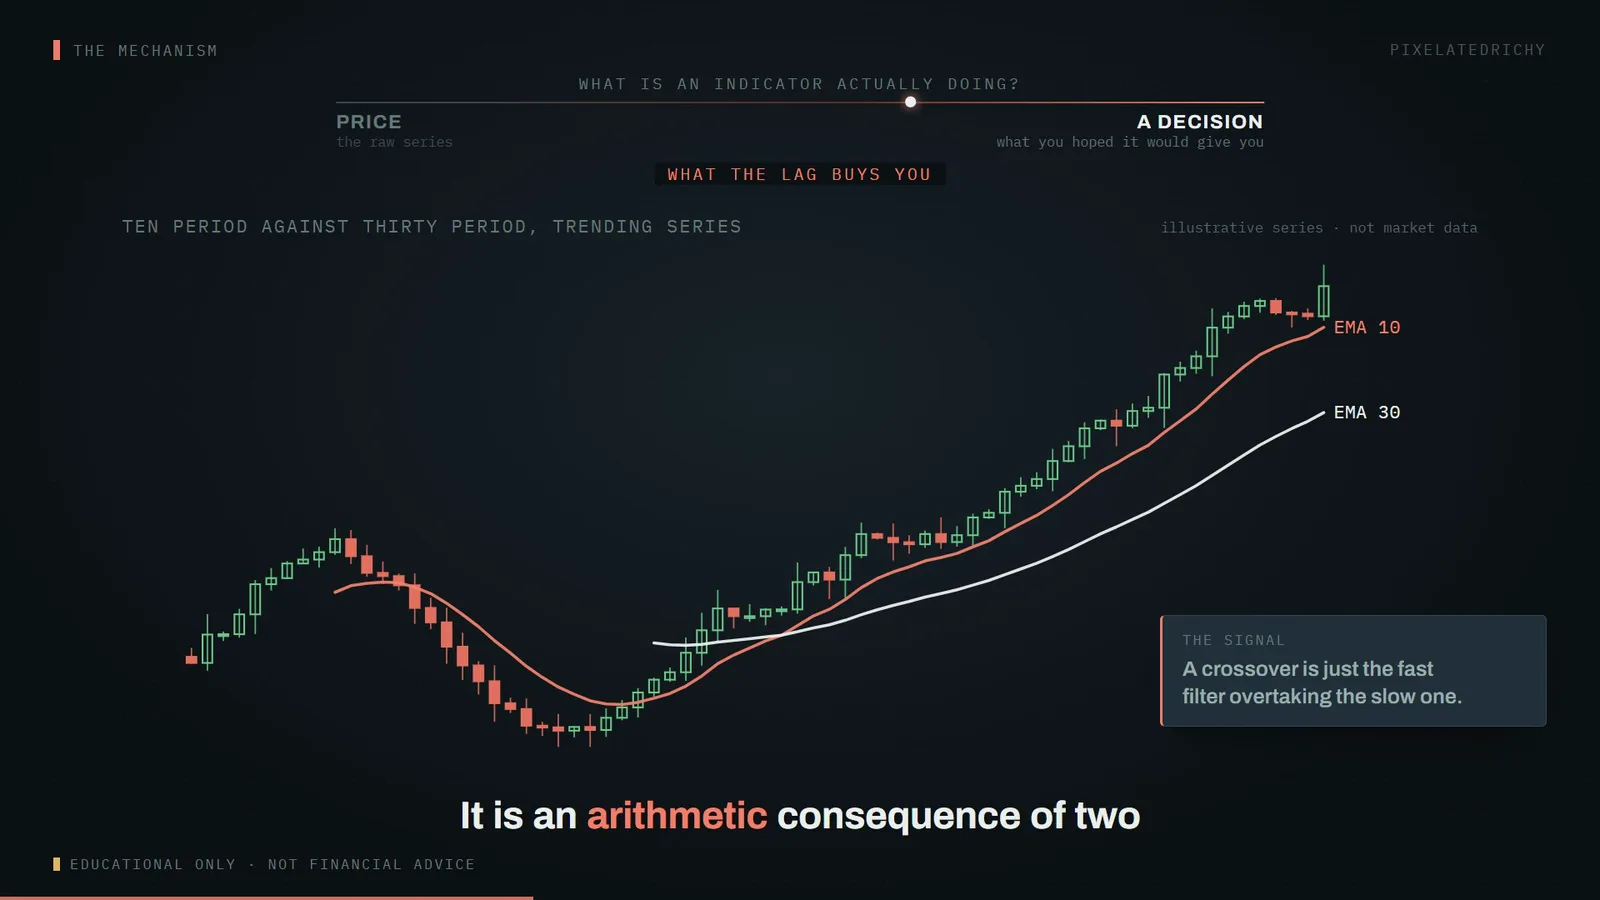
A crossover is just the fast filter overtaking the slow one. So let us take the trade, with the rules written down in advance: enter long when the 10 crosses above the 30, stop 0.9% below entry, target 1.8% above — two times the risk.
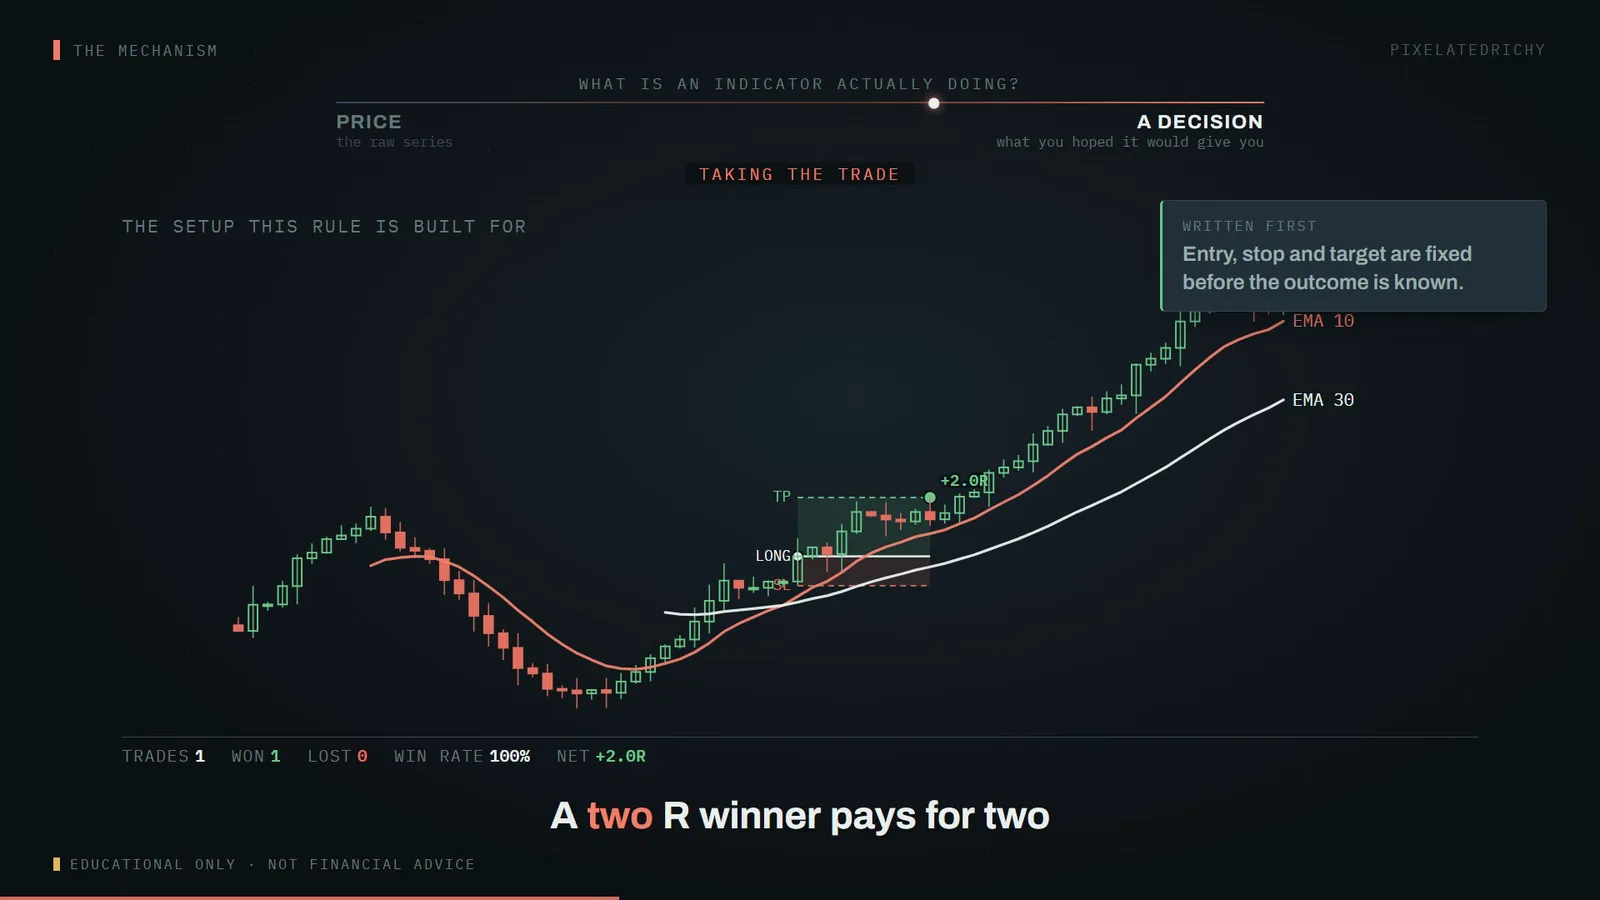
Target hit nine bars later: +2.0R. R is the unit that matters here — not dollars, but multiples of what you put at risk. A 2R winner pays for two full losses.
That series was chosen to contain the setup the rule is designed for, which is what a worked example is for. Now run the identical rule — same periods, same stop, same target — against a series with no trend underneath it.
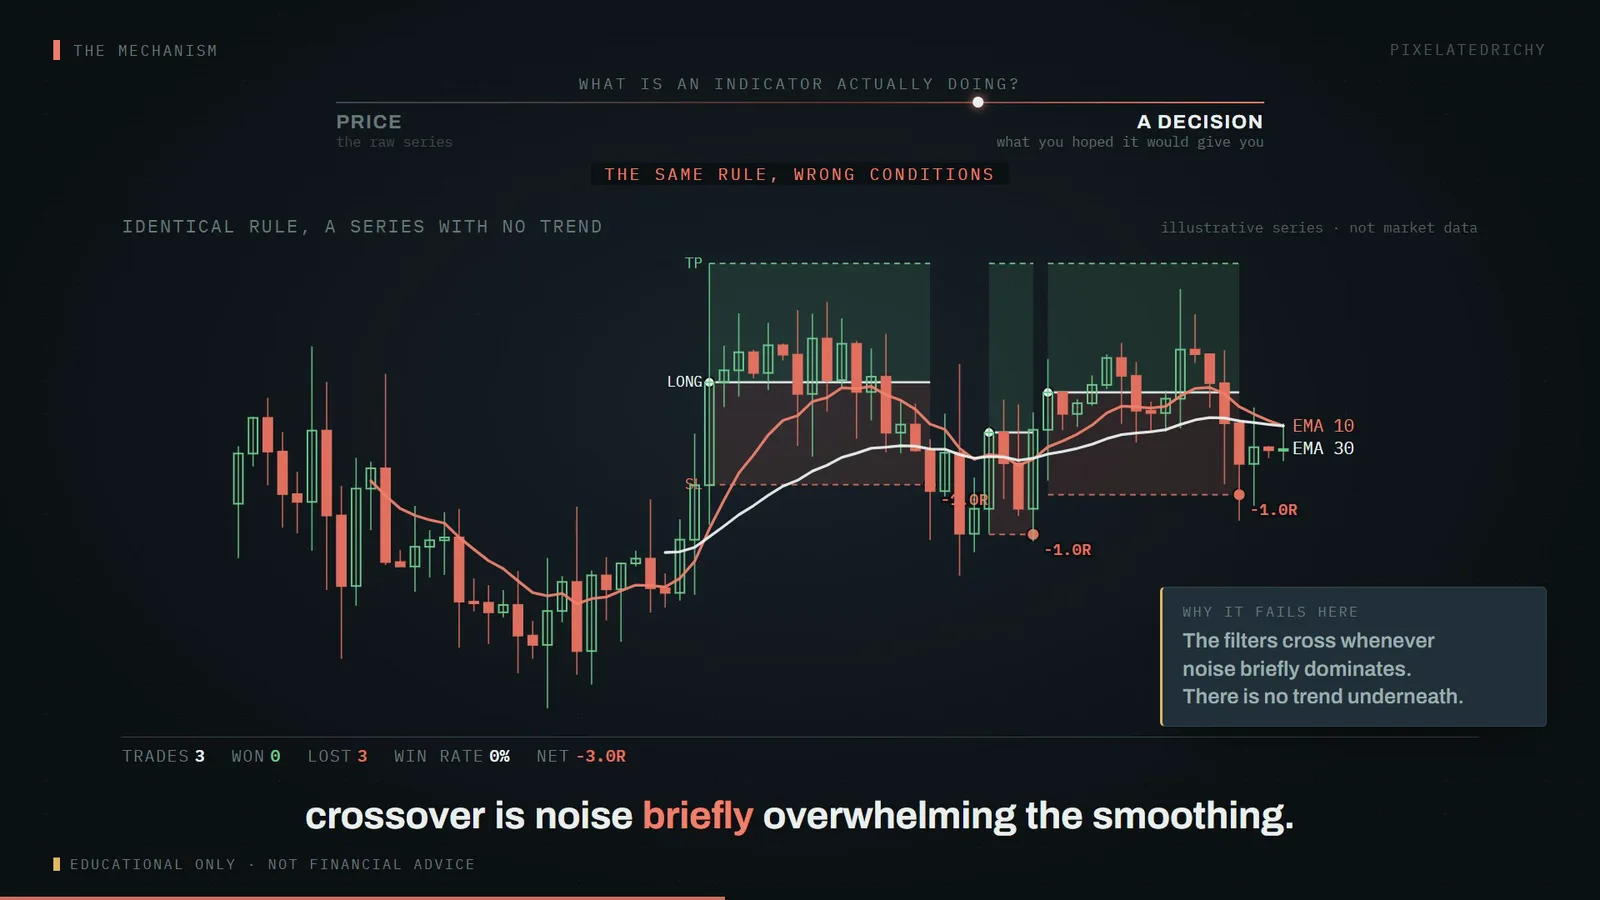
Three trades. Three stop-outs. −3.0R. Nothing about the rule changed; the thing it filters for was not there. The filters cross whenever noise briefly dominates, and in a market with no trend that is most of the time.
Both outcomes were computed, not chosen. The code walks the candles forward and reports which level price reached first, and where a single candle's range spans both the stop and the target it takes the stop — because intrabar order is unknowable from OHLC alone, and assuming the favourable fill is how backtests quietly inflate themselves. There is deliberately no way for a script to assert that a trade won.
The transplant problem
There is real published work on the opening range break. The strongest result tests a 5-minute ORB on QQQ over 2016–2023 and reports a 33% annualised alpha net of commissions, with a TQQQ-based version returning 1,484% against QQQ buy-and-hold at 169%.4
Read the first row of that again: QQQ. It is a result about US equities.
| US equities | Spot foreign exchange | |
|---|---|---|
| Opening auction | one a day | none |
| Order flow | concentrated at the open | three overlapping sessions |
| Closing price | one everyone agrees on | no consolidated tape |
| The range | created by overnight gaps | no single reference open |
The opening range strategy is named after a thing the foreign exchange market does not straightforwardly have. And the headline 1,484% is the three-times-leveraged version — leverage multiplies the drawdowns with exactly the same fidelity.
What to look at next
The useful move is not adding a fifth indicator. It is computing, once, how far behind price each of your current ones actually sits.
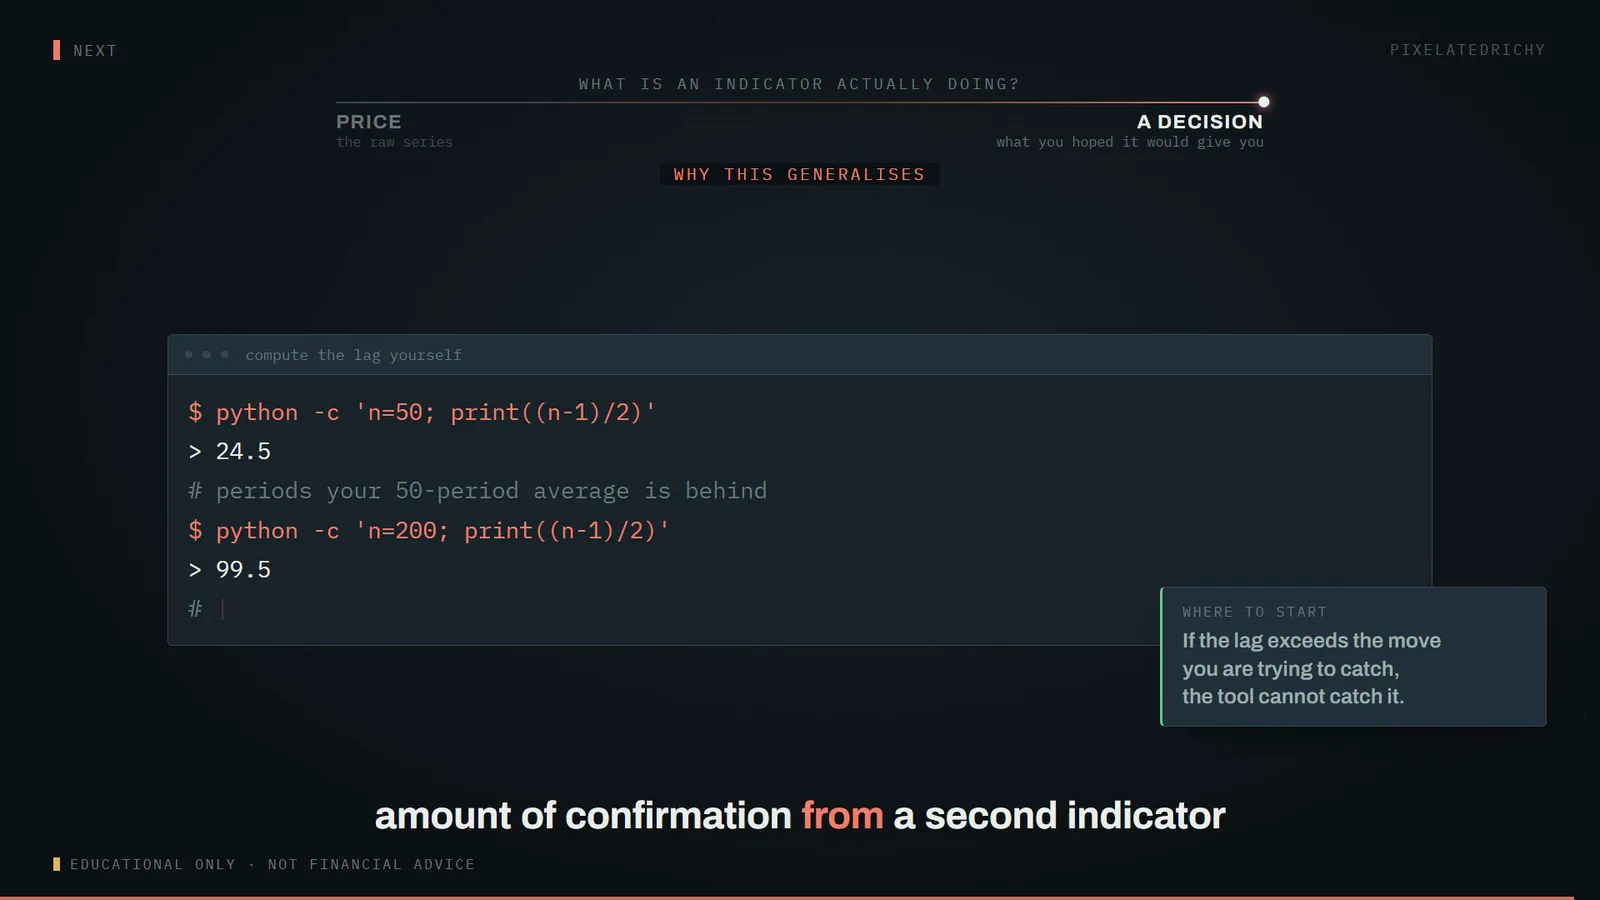
$ python -c 'n=50; print((n-1)/2)'
> 24.5
// periods of lag, built in
Then ask of each indicator on your chart: what does this compute, and what does it assume is present in the data? A moving average assumes there is a trend to find. MACD assumes the interesting movement lives in a particular band. An opening range break assumes there is an opening. When the assumption fails the indicator does not warn you — it keeps producing signals, and they are exactly the signals it was always going to produce.
One caveat on all of the above. Every price series in this article is synthetic and labelled as such on the charts themselves. Each was chosen to contain the setup being demonstrated, because a worked example has to contain the thing it demonstrates. A clean example is not a win rate, and four demonstrations are not evidence.
Sources
Footnotes
-
ESMA35-43-1000, Additional information on the agreed product intervention measures relating to CFDs and binary options — the standardised risk-warning rule requiring each provider to publish its own figure, recalculated quarterly over the preceding 12 months. https://www.esma.europa.eu/sites/default/files/library/esma35-43-1000_additional_information_on_the_agreed_product_intervention_measures_relating_to_contracts_for_differences_and_binary_options.pdf ↩
-
ESMA, ESMA agrees to prohibit binary options and restrict CFDs to protect retail investors — NCA analyses across EU jurisdictions found 74–89% of retail CFD accounts lose money, with average losses per client of €1,600–29,000. https://www.esma.europa.eu/press-news/esma-news/esma-agrees-prohibit-binary-options-and-restrict-cfds-protect-retail-investors ↩
-
StockCharts ChartSchool, Moving Averages — Simple and Exponential — the
2/(n+1)multiplier and the SMA seed convention. https://chartschool.stockcharts.com/table-of-contents/technical-indicators-and-overlays/technical-overlays/moving-averages-simple-and-exponential ↩ -
Carlo Zarattini and Andrew Aziz, Can Day Trading Really Be Profitable? — 5-minute ORB on QQQ, 2016–2023: 33% annualised alpha net of commissions; the TQQQ version returned 1,484% against QQQ buy-and-hold at 169%. https://papers.ssrn.com/sol3/papers.cfm?abstract_id=4416622 ↩