Software Engineering
How big should your connection pool actually be?
Your app is slow, your database CPU is idle, and every request is hanging. The instinct is to raise the connection pool size.

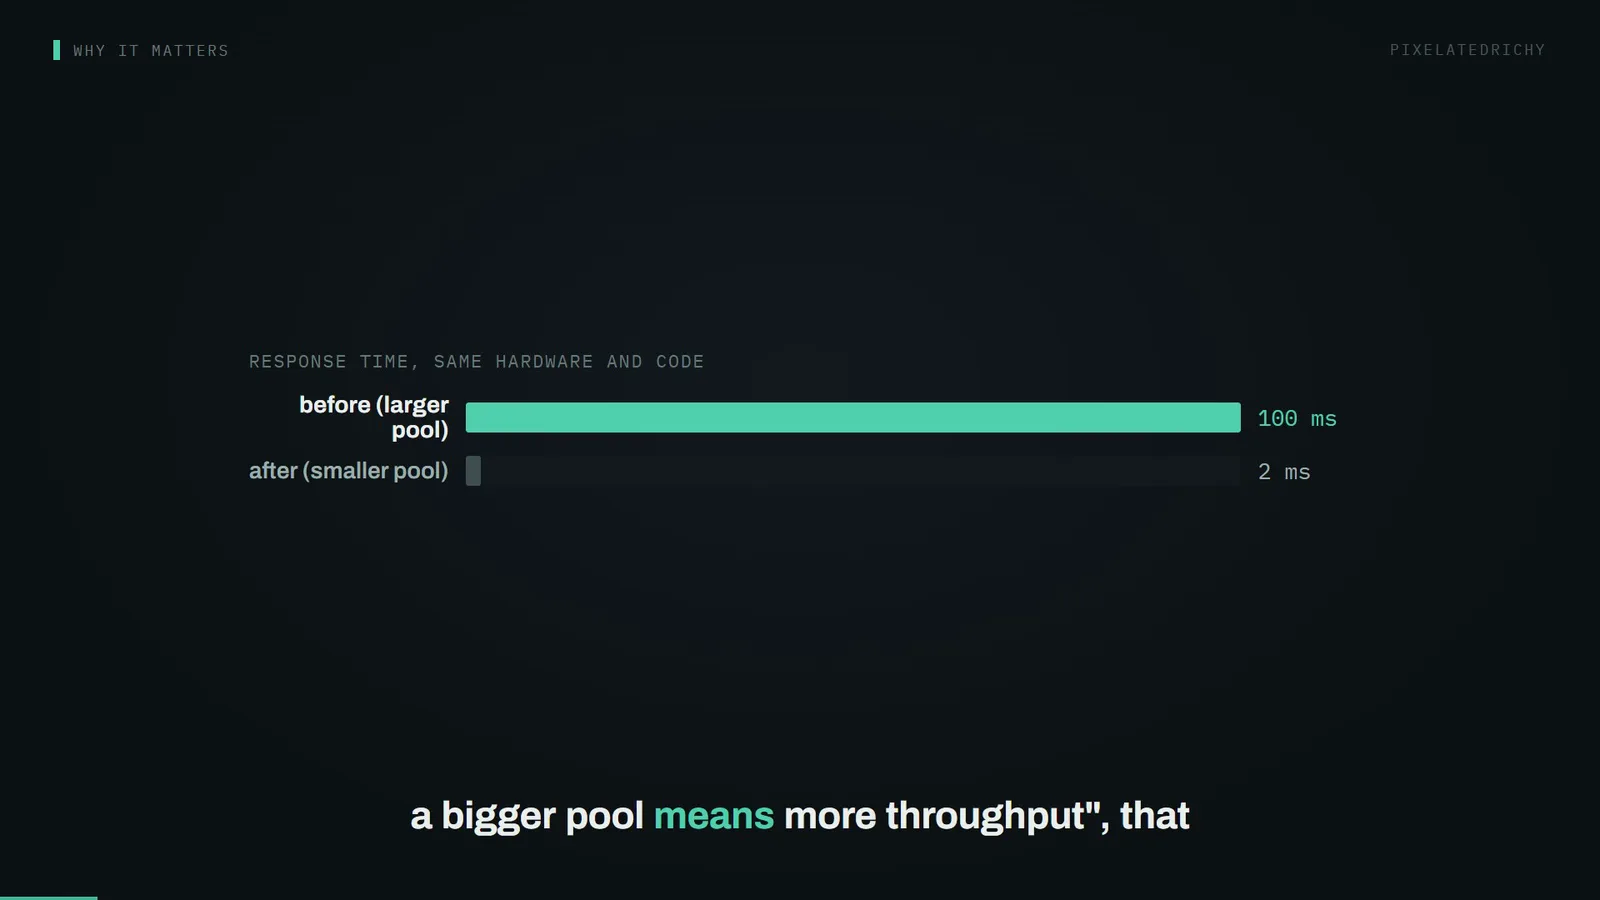
A team cut their connection pool and response times went from around 100ms to around 2ms. Same hardware. Same queries. Same code. The only change was allowing fewer things to happen at once.
That is not a tuning trick. It is what queueing theory predicts, and the reason it keeps surprising people is that the instinct it violates feels like common sense.
Why it matters
"More connections means more throughput" is one of those beliefs that is almost never stated out loud, which is exactly why it never gets examined. It is baked into defaults, into tutorials, and into the shape of most incident postmortems.
The cost of getting it wrong is not a slightly slower service. It is a specific and violent failure mode that looks like a database problem while the database sits nearly idle.
The mental model
The number of connections you actually need is not a matter of taste. It comes out of Little's Law:
L = λW
where L is the average number of items in a system, λ is the arrival rate, and W is the average time each item spends inside.
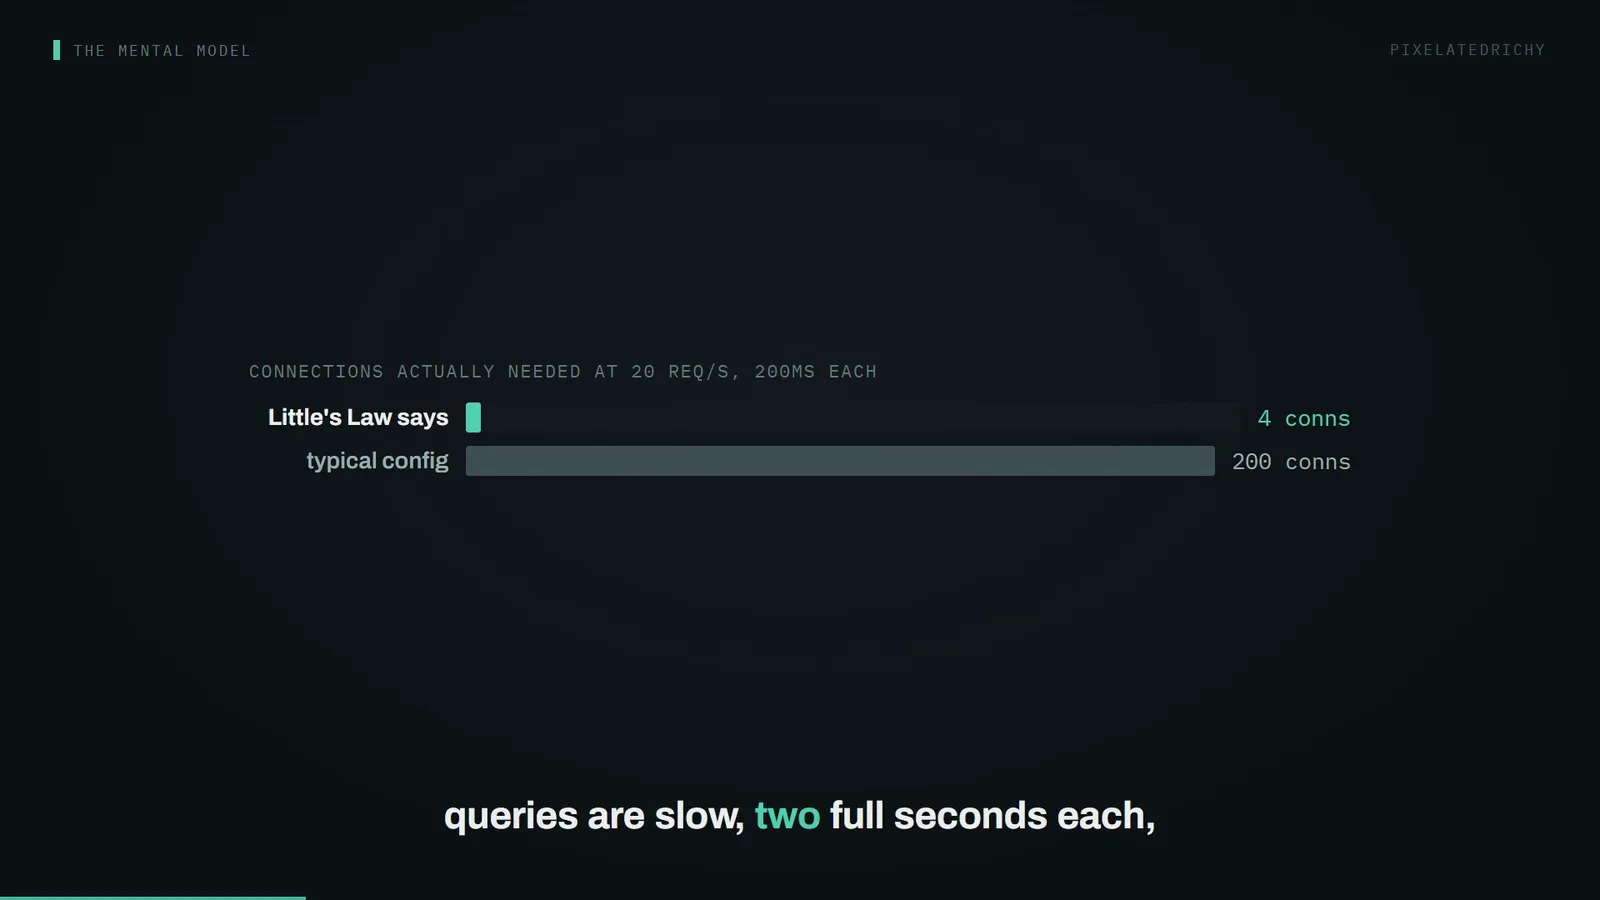
At 20 requests per second, each holding a connection for 200ms:
L = 20 × 0.2 = 4 connections
Four. The typical configuration in that situation is 200 — a factor of fifty more than the work requires.
And the law cuts both ways, which is the part worth internalising:
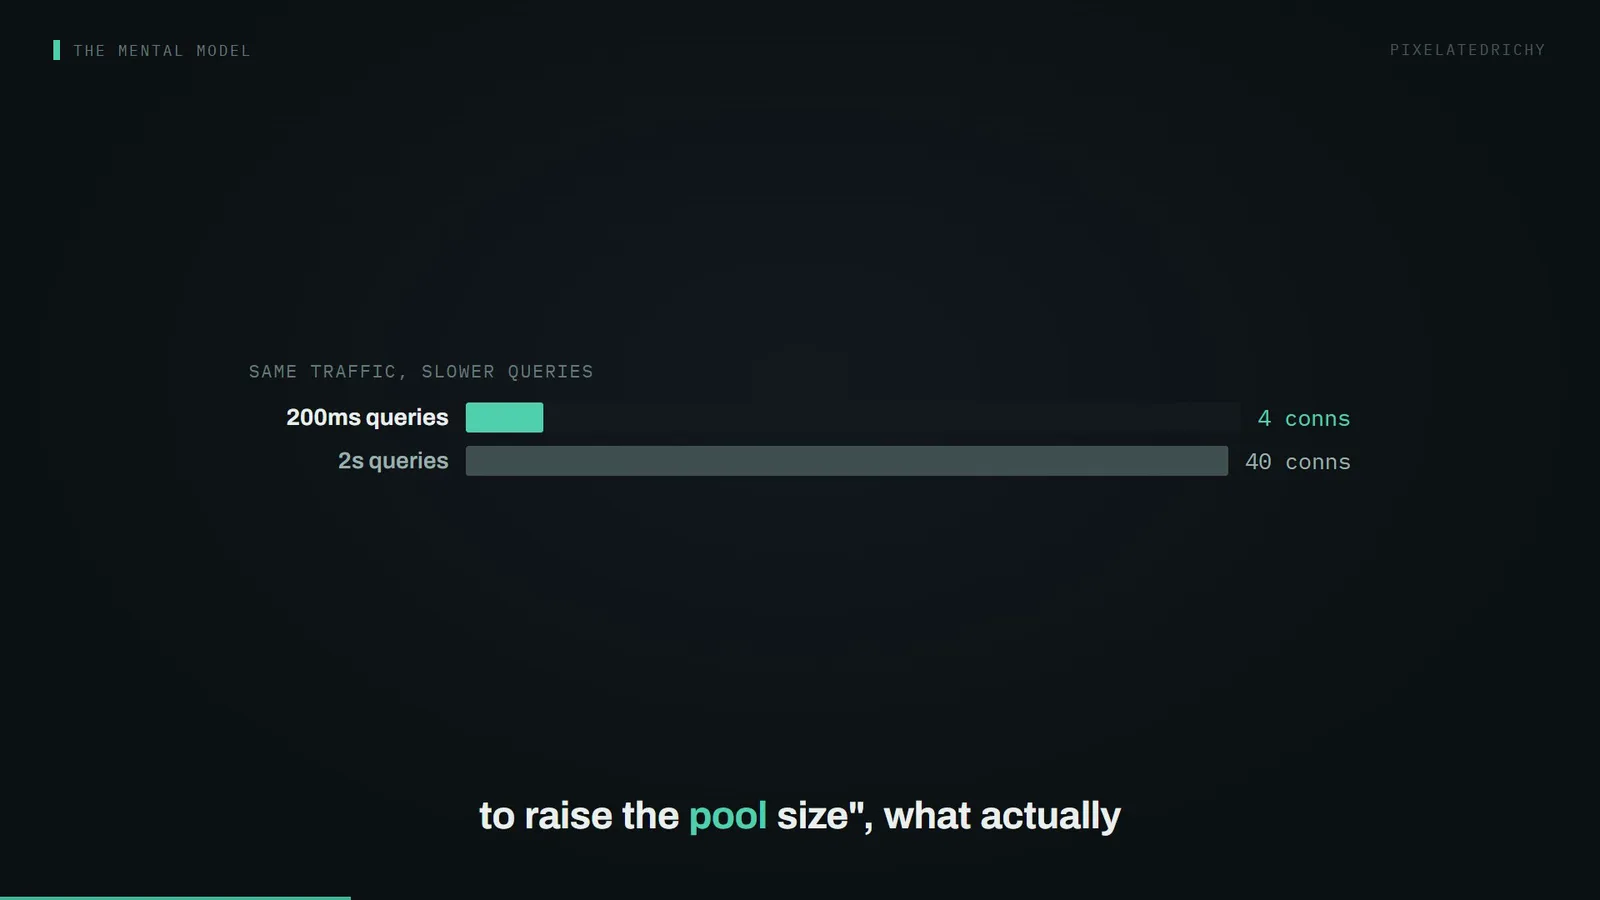
| query time | arrival rate | connections needed |
|---|---|---|
| 200ms | 20 req/s | 4 |
| 2s | 20 req/s | 40 |
Nothing about the traffic changed. The pool requirement moved by 10× because W did. If your pool size is a constant, it is only correct for one value of W, and query time is the thing that moves most in an incident.
The mechanism
Past the point where every CPU core has work, additional concurrency does not add throughput. It adds context switching, lock contention and cache pressure — so the server does the same amount of useful work while spending more of its time on coordination.
The HikariCP pool-sizing guide gives the formula that falls out of this:
connections = ((core_count × 2) + effective_spindle_count)

// 4-core server, one spinning disk:
//   (4 × 2) + 1  =  9 connections
Nine. The "× 2" is there because a thread is not using its core while it waits on I/O, so a little oversubscription keeps the cores fed. It is not there to let you scale the number up until it feels generous.
The failure mode
This is where an oversized pool stops being merely wasteful and becomes actively dangerous.

| t+0s | pool fully checked out |
| t+1s | requests queue, then time out |
| t+2s | clients retry — demand doubles |
| t+3s | the database is thrashing, not working |
The retries are the detail that makes it a spiral rather than a dip. Every timed-out request becomes two requests. A large pool makes this worse than a small one, because it lets far more concurrent work reach a database that is already past the point of doing anything useful with it.
A smaller pool fails differently, and better. Requests wait in your application, where waiting is cheap, instead of waiting inside the database, where it is not.
Back to the anomaly
The 50× improvement was not the pool getting faster. It was the database being allowed to finish things. With fewer connections competing, each query completed sooner, W fell, and by Little's Law the number of connections needed fell with it — which left the pool with headroom it had never had before.
What to actually watch
Pool size tells you almost nothing. The number worth alerting on is how long a thread waits to be handed a connection:
hikaricp_connections_acquire_nanos

// healthy: essentially zero — a connection is waiting for you
// rising:  threads are queueing for the pool
Exposed by the HikariCP integration and equivalents elsewhere. If acquire time is flat at zero and your service is slow, the pool is not your problem and making it bigger will not help.
Where else this applies
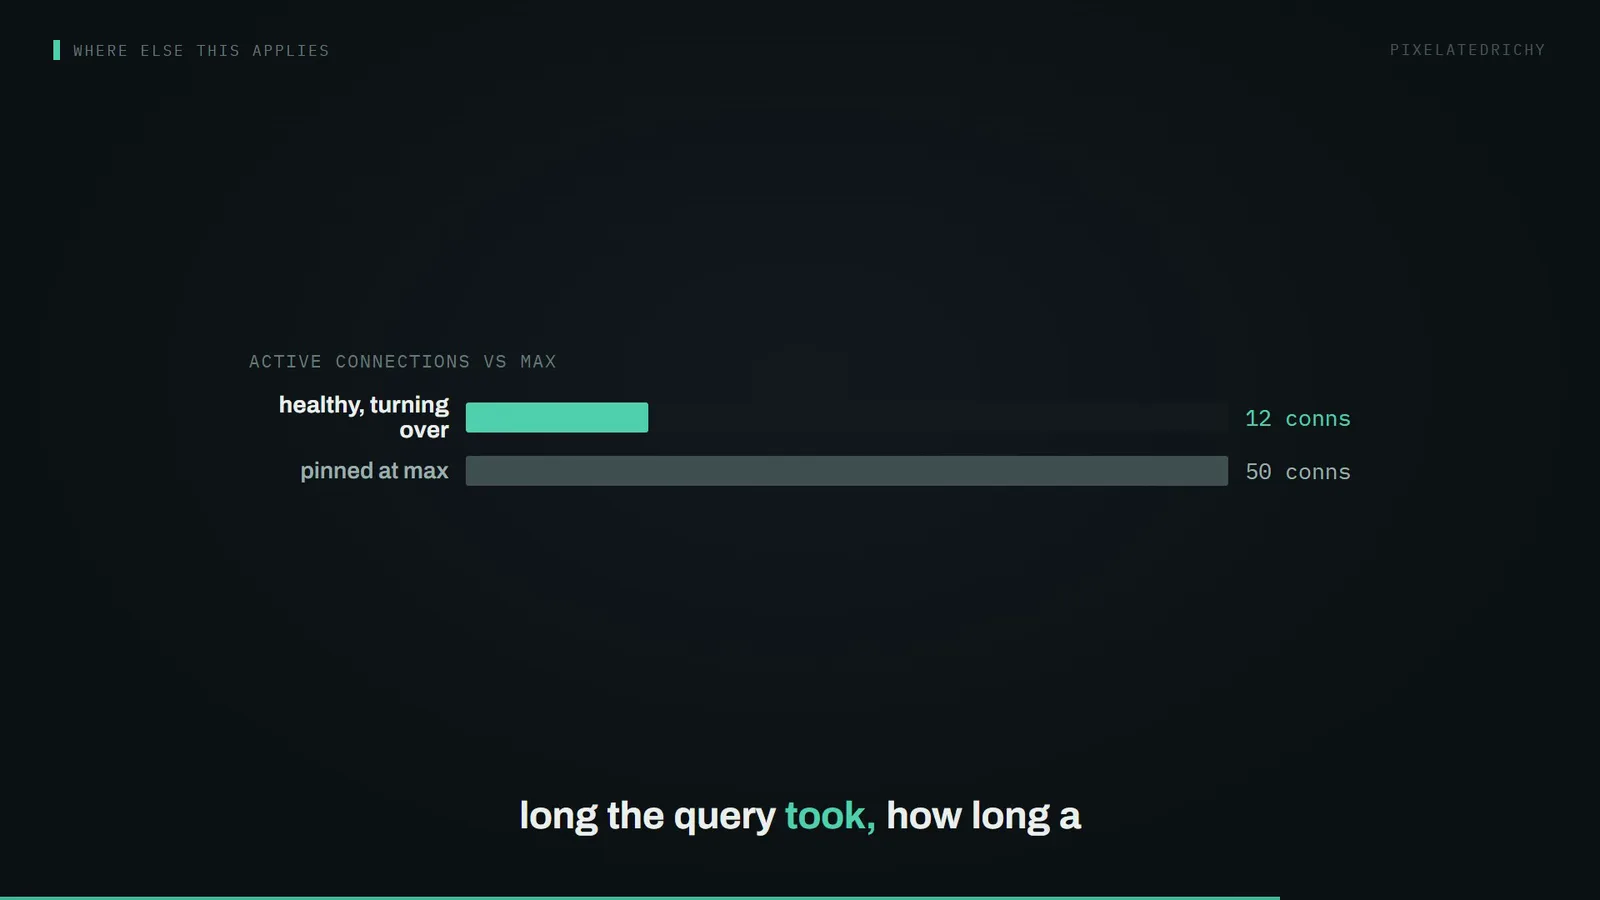
The same arithmetic governs thread pools, worker queues, HTTP client concurrency limits and rate limiters. Anywhere a fixed number of servers process arriving work, L = λW holds, and "add more workers" stops helping at the point where the underlying resource saturates.
There is one genuine exception worth knowing, because it is the case where a larger pool is correct:
pool size = Tn × (Cm - 1) + 1

// Tn = max threads
// Cm = max simultaneous connections held by one thread
If a single thread can hold more than one connection at a time — nested transactions, a query issued while another is open — a pool sized purely for throughput can deadlock, with every connection held by a thread waiting for a connection that will never come free. This formula guarantees at least one thread can always make progress.
What to look at next
Measure your actual W under load, not at rest, and compute λW for your real arrival rate. Then compare that to your configured maximum. In most services the gap is an order of magnitude or more.
The question worth asking next: what happens to that number when the queue itself becomes the bottleneck?
Sources
- HikariCP, About Pool Sizing — the ~50× improvement from reducing pool size alone, the
(core_count × 2) + effective_spindle_countformula, the observation that past core count more threads is slower not faster, and the deadlock-avoidance formula. https://github.com/brettwooldridge/HikariCP/wiki/About-Pool-Sizing - Datadog, HikariCP integration —
hikaricp_connections_acquire_nanosas the exposed acquire-time metric. https://docs.datadoghq.com/integrations/hikaricp/